Showing posts with label PERL. Show all posts

Sunday, May 1, 2016

Ensembl Perl API to get all intron lengths in Human genom

The below script will get all stable id's from Ensembl and prints out the intron lengths for each transcript of every gene. Along with intron length, the flanking exon id's are also printed. One can get the upstream and downstream intron length for each exon using the output.

The output would look like this:
Gene Id                     Transcript Id            Previous Exon          Next Exon               Intron length
ENSG00000084674 ENST00000233242 ENSE00000932268 ENSE00000932269 717 ENSG00000084674 ENST00000233242 ENSE00000932269 ENSE00000932270 2338 ENSG00000084674 ENST00000233242 ENSE00000932270 ENSE00000932271 112 ENSG00000084674 ENST00000233242 ENSE00000932271 ENSE00000719046 1100 ENSG00000084674 ENST00000233242 ENSE00000719046 ENSE00000718984 261 ENSG00000084674 ENST00000233242 ENSE00000718984 ENSE00000932272 863 ENSG00000084674 ENST00000233242 ENSE00000932272 ENSE00000932273 1663 ENSG00000084674 ENST00000233242 ENSE00000932273 ENSE00000718481 1240 ENSG00000084674 ENST00000233242 ENSE00000718481 ENSE00000542194 482

 #!/usr/bin/perl  
 use strict;  
 use warnings;  
 use Bio::EnsEMBL::Registry;  
 use Bio::SeqIO;  
 use Getopt::Long;  
 my $registry = 'Bio::EnsEMBL::Registry';  
 ## Load the databases into the registry  
 $registry->load_registry_from_db(  
  -host => 'ensembldb.ensembl.org',  
  -user => 'anonymous'  
 );  
 ## Get the gene adaptor for human  
     my $gene_adaptor = $registry->get_adaptor( 'Human', 'Core', 'Gene' );  
     # Fetch my gene of interest usning ensemble ID  
     my @gene_ids = @{$gene_adaptor->list_stable_ids()};  
 foreach my $geneid(@gene_ids){  
 #print "$geneid\n";  
 my $gene = $gene_adaptor->fetch_by_stable_id($geneid);  
  foreach my $transcript (@{ $gene->get_all_Transcripts }) {  
   foreach my $intron (@{ $transcript->get_all_Introns }) {  
   print $gene->stable_id,"\t",$transcript->stable_id,"\t",$intron->prev_Exon->stable_id,"\t",$intron->next_Exon->stable_id,"\t",$intron->length,"\n";  
   }  
  }  
 }  

Tuesday, March 17, 2015

HGT candidate genes - GERP score distribution

HGT candidate genes have been identified in vertebrate species based on gene absence/presence in metazoans. The actual workflow can be found in figure S4.
Interestingly, they identify 145 genes that are candidates for HGT into all primates from various taxon and another 51 from viruses. They provide Ensemble gene id's for these genes in the Human genome.

Of the 145 genes, only 135 could be found in the Ensemble biomart today (Ensemble 79). The following ten genes have been "retired" and are not used in below analysis. These genes seem to be randomly drawn from the different "confidence classes" used in the paper.

ENSG00000107618    class A HGT    Validated
ENSG00000157358    class A HGT    Validated
ENSG00000196333    class C HGT    Not-validated
ENSG00000204486    class C HGT    Validated
ENSG00000204502    class C HGT    Validated
ENSG00000204513    class C HGT    Validated
ENSG00000212857    class C HGT    Not-validated
ENSG00000256062    class A HGT    Validated
ENSG00000260383    class B HGT    Not-validated
ENSG00000263074    class B HGT    Validated

ENSG00000107618 has been merged with ENSG00000265203 which is also a HGT candidate. ENSG00000256062 has been merged into ENSG00000175164, this is the much talked about ABO blood group gene. ENSG00000260383 has been merged into ENSG00000179832 which also happens to be a HGT candidate. ENSG00000263074 is merged into ENSG00000141337 (arylsulfatase G).

A total of 4018 exons could be found for these 135 genes. GERP scores could not obtained for 8 of these genes [ENSG00000066813,ENSG00000183248,ENSG00000183549,ENSG00000183747,
ENSG00000204510,ENSG00000229571,ENSG00000232423,ENSG00000243073]. Here, we obtain the GERP scores for each base of all these exons. Example code from the web was updated to use a bed file as input and print the GERP score for each base within the bed intervals.

 #!/usr/bin/env perl  
 use strict;  
 use warnings;  
 use lib '~/biomart-perl/lib';  
 use Bio::EnsEMBL::Registry;  
 use Bio::EnsEMBL::Utils::Exception qw(throw);  
 my $reg = "Bio::EnsEMBL::Registry";  
 my $species = "Homo sapiens";  
 my $line = "";  
 open FILE1, $ARGV[0] or die $!;  
 $reg->load_registry_from_db(  
    -host => "ensembldb.ensembl.org",  
    -user => "anonymous",  
 );  
 #get method_link_species_set adaptor  
 my $mlss_adaptor = $reg->get_adaptor("Multi", "compara", "MethodLinkSpeciesSet");  
 my $mlss = $mlss_adaptor->fetch_by_method_link_type_species_set_name("GERP_CONSERVATION_SCORE", "mammals");  
 throw("Unable to find method_link_species_set") if (!defined($mlss));  
 my $slice_adaptor = $reg->get_adaptor($species, 'core', 'Slice');  
 throw("Registry configuration file has no data for connecting to <$species>") if (!$slice_adaptor);  
 my $cs_adaptor = $reg->get_adaptor("Multi", 'compara', 'ConservationScore');                 
 while($line=<FILE1>){  
 #$line=$ARGV[0];  
 chomp $line;  
 my @parts=split('\t',$line);  
 my $seq_region = $parts[0];  
 my $seq_region_start = $parts[1];  
 my $seq_region_end =  $parts[2];  
 my $slice = $slice_adaptor->fetch_by_region('toplevel', $seq_region, $seq_region_start, $seq_region_end);  
 throw("No Slice can be created with coordinates $seq_region:$seq_region_start-$seq_region_end") if (!$slice);  
 my $display_size = $slice->end - $slice->start + 1;   
 my $scores = $cs_adaptor->fetch_all_by_MethodLinkSpeciesSet_Slice($mlss, $slice, $display_size);  
 #print "number of scores " . @$scores . "\n";  
 foreach my $score (@$scores) {  
   if (defined $score->diff_score) {  
 #     printf("position %d observed %.4f expected %.4f difference %.4f\n", $score->position, $score->observed_score, $score->expected_score, $score->diff_score);  
      printf("$parts[3]\t$parts[4]\t%.4f\n",$score->diff_score);  
   }  
 }  
 }  
 close FILE1;  

Negative GERP scores suggest that the sites are probably evolving neutrally.

 read.table(file="GERP.scores",header=FALSE,stringsAsFactors=FALSE)->M  
 as.data.frame(aggregate(M,list(M$V2),mean))->N  
 as.data.frame(aggregate(M,list(M$V2),max))->P  
 N$Group.1[N$V3<0]->negative.mean.GERP  
 jpeg("GERP_HGT_distribution.jpeg")  
 boxplot(as.numeric(M$V3)~M$V2,outline=FALSE,col=ifelse(unique(M$V2) %in% negative.mean.GERP, "red", "blue"),xaxt="n",ylab="GERP score",main="GERP score by gene")  
 legend("bottomright", c("Negative mean GERP", "Positive mean GERP"), fill = c("red", "blue"))  
 dev.off()  

Despite 41 genes having a mean GERP score less than 0, each of these genes have atleast a few sites that are having positive GERP scores.


Based on above arguments, it could be suggested that 10 of the 145 genes are probably annotation artifacts. The 127 genes for which GERP scores could be obtained from whole genome alignments show moderate levels of conservation, suggesting these genes are probably not artifacts.

Thursday, January 29, 2015

Mapping centromeres using Optical Map data

Optical mapping has become rather common for applications ranging from genome assembly improvement and validation to structural variation discovery. Validation of the rice genome using Optical map data also helped map centromeres and even span one centromere. However, in some cases centromeres have been found to correspond to regions that have poor mapping of optical maps, presumably due to the presence of tandem repeats that lack unique restriction sites. Without the availability of genetic linkage maps or other evidence, those working with NGS based draft assemblies have speculated that large gaps in the optical map correspond to centromeres or other repeats.

The Human genome has a higher quality as well as availability of various other resources such as genetic linkage maps, BAC's, FISH etc in addition to the availability of optical mapping data. Centromeres have been mapped in the human genome with various other methods and provides an ideal case to investigate the patterns(or lack thereof) shown by optical maps near centromeres. Optical map data for the human and mouse genome from published studies have been made available as bigBed files. This provides a unique resource to understand the behavior of optical maps near centromeres.

First we download the bigBed files for the human genome Hg38 and convert it to bed12 format. This can then be converted to bed format using the convert perl script

 wget ftp://ngs.sanger.ac.uk/production/grit/track_hub/hg38/om_align_GM10860.bigBed  
 wget ftp://ngs.sanger.ac.uk/production/grit/track_hub/hg38/om_align_GM15510.bigBed  
 wget ftp://ngs.sanger.ac.uk/production/grit/track_hub/hg38/om_align_GM18994.bigBed  
 for i in om_align_GM10860 om_align_GM15510 om_align_GM18994  
 do  
 bigBedToBed "$i".bigBed "$i".bed  
 perl convertBed.pl "$i".bed > "$i"_full.bed  
 done  

Perl script called covertBed.pl to convert bed12 to bed format.

 #!/usr/bin/perl  
 my $bed12file = $ARGV[0];  
 open(FILE1, $bed12file);  
      while($header1=<FILE1>) {  
      chomp $header1;  
      my @parts=split(/\t/,$header1);  
      my @parts2=split(/\,/,$parts[10]);  
      my @parts3=split(/\,/,$parts[11]);  
      my $arrSize = @parts2;  
           for($i=0;$i<$arrSize;$i++){  
           $start=$parts[1]+$parts3[$i];  
           $end=$start+$parts2[$i];  
           print "$parts[0]\t$start\t$end\t$parts2[$i]\n";  
           }  
      }  
 close FILE1;  
We next create 50Kb windows across the human genome to analyze the distribution of cut sites in the Optical map.
 mysql --user=genome --host=genome-mysql.cse.ucsc.edu -B -A -D hg38 -e 'select chrom,size from chromInfo' > chromhg38.genome  
 bedtools makewindows -g chromhg38.genome -w 50000|sort -k1,1 -k2,2n > 50kb.wins  
All 3 Optical maps are combined and the mean of the fragment lengths as well their counts are tabulated in 50Kb windows.
 cat *_full.bed|sort -k1,1 -k2,2n > full_all.bed  
 bedtools map -a 50kb.wins -b full_all.bed -c 4 -o mean -null NA > all.mean  
 bedtools map -a 50kb.wins -b full_all.bed -c 4 -o count -null NA > all.count  
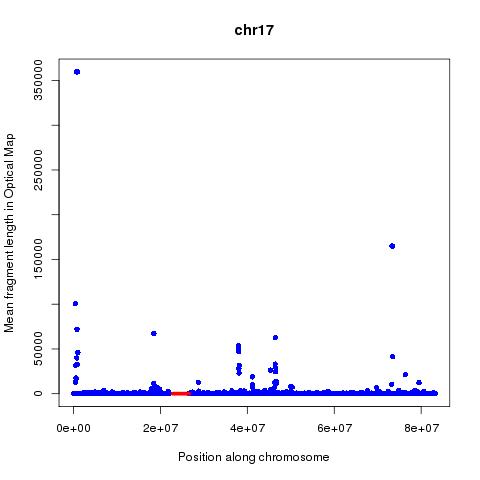
Analysis of these numbers across each chromosome suggests that mean fragment size might be a better predictor of centromeres than the count. The position of the centromeres is obtained from the UCSC tables using below command:

 mysql --user=genome --host=genome-mysql.cse.ucsc.edu -B -A -D hg38 -e 'select chrom,chromStart,chromEnd from centromeres'|grep -v "chromStart" > centromeres.hg38.genome  
Running below R code will create graphical images showing the position of the centromeres by red lines and the mean fragment size by blue dots.
 for (chr in c("chr1","chr2","chr3","chr4","chr5","chr6","chr7","chr8","chr9","chr10","chr11","chr12","chr13","chr14","chr15","chr16","chr17","chr18","chr19","chr20","chr22","chrX"))  
 {  
 read.table(file="all.mean",header=F)->M  
 read.table(file="centromeres.hg38.genome",header=F)->C  
 interleave <- function(v1,v2)  
 {  
 ord1 <- 2*(1:length(v1))-1  
 ord2 <- 2*(1:length(v2))  
 c(v1,v2)[order(c(ord1,ord2))]  
 }  
 jpeg(paste(chr,"_OM.jpeg",sep=""))  
 plot(M$V2[M$V1==chr],M$V4[M$V1==chr],xlab="Position along chromosome",ylab="Mean fragment length in Optical Map",main=chr,col="blue",pch=16)  
 lines(interleave(C$V2[C$V1==chr],C$V3[C$V1==chr]),rep(0.2,length(interleave(C$V2[C$V1==chr],C$V3[C$V1==chr]))),col="red",lwd=5)  
 dev.off()  
 }  
Based on below figures, it can be hypothesized that on chr1, chr2, chr3(to certain extent), chr7, chr9, chr11(to certain extent),chr12,chr13, chr14,chr15 and chr20 the mean optical fragment size goes up near centromeres.


Based on the above analysis can one conclude that it is possible to map Centromeres using Optical mapping data? Far from it, the many false positives and lack of signal in many cases are worrying. The following questions are of importance:
 
  1. How does the quality of the genome assembly in the regions adjoining the centromere affect the ability to map centromeres?
  2. How does the enzyme used and repeat content and base composition of the centromere affect the precision of attempts aimed at mapping the centromere?

Tuesday, November 18, 2014

Optical map dot plot

Using Optical Maps to scaffold genomes of bacteria seems to be a fairly common practice. While it is yet to find widespread use in Eukaryotic species, it has found some success in species such as the cow, rice and parrot.

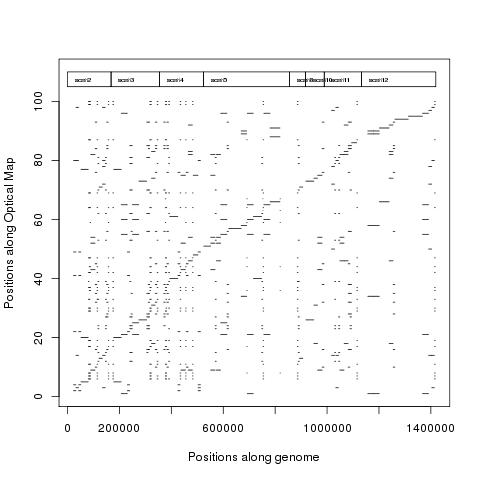
Here we use the assembled Optical map provided as an example with the SOMA package to demonstrate Optical map dot plot creation.

First, we perform an all vs all search between the optical map and in-silico digest of the genome using below script. The script has the parameter called search radius which decides how much flexibility is to be allowed while searching.
 #!/usr/bin/perl   
 use warnings;   
 use Math::Round qw(nearest);  
 use Set::IntSpan;  
 #  
 #perl Map_Optical.pl scaffold.silico soma_format_maps/1.map  
 ## Input parameters  
 %cutlens=();  
 my $roundoffto=10;  
 my $searchradius=200;  
 open CUTSITES, $ARGV[0] or die $!;  
 while($line = <CUTSITES>){  
 chomp $line;  
 my @header = split / /, $line;  
 my $scaffold=$header[0];  
 my $scaflen=$header[1];  
 my $totalcutsites= $header[2];  
 $line = <CUTSITES>;chomp $line;  
 my @cutsites = split / /, $line;  
 my $iso="";  
 my $cutcount=0;  
 my $previous=0;  
   foreach $iso (@cutsites){  
    my $cutlength=$iso-$previous;  
    if($previous>0){  
    $cutcount++;  
    $key=$scaffold . "#" . $cutcount;  
    $cutlens{$cutlength}{$key}=$previous . "_" . $iso;  
    }  
    $previous=$iso;  
    }  
          }#end of while loop  
 close CUTSITES;  
 #print "Done reading Silico-digest provided in file: $ARGV[0]\n";  
 my $mapsite=0;  
 my %mapmaps=();  
 open SOMAP, $ARGV[1] or die $!;   
 while($line = <SOMAP>){   
 chomp $line;  
 my @header2 = split / /, $line;  
 $mapsite++;  
 my $testvalue=$header2[0];  
 my $teststart=$testvalue-$searchradius;  
 my $testend=$testvalue+$searchradius;  
 #print "Searching for $testvalue lengths with a search radius of $searchradius.\n";  
 my $i="";  
 for($i=$teststart;$i<$testend;$i++){  
    foreach my $key (keys %{$cutlens{$i}}) {  
    my @keysp = split /\#/, $key;  
      my @beds= split /\_/, $cutlens{$i}{$key};  
 # scaffold     start     end     map_position     search_radius_hit     map_frag_len     cut_frag_len  
 #   print "$keysp[0]\t$beds[0]\t$mapsite\t$i\t$testvalue\t$keysp[1]\n";  
 #   print "$keysp[0]\t$beds[1]\t$mapsite\t$i\t$testvalue\t$keysp[1]\n";  
 #   print "$keysp[0]\tNA\tNA\n"  
      print "$keysp[0]\t$beds[0]\t$beds[1]\t$mapsite\t$i\t$testvalue\t$keysp[1]\n";  
    }  
 }  
 }#end of while loop  
 close SOMAP;  
After performing a search of the Optical map, the output bed file can be converted into a dotplot file using below script:
 #!/usr/bin/perl  
 use warnings;  
 ##  
 ##perl getfull.pl genome.fa.fai assembled.map.bed   
 ### Input parameters  
 #  
 my %cumlen=();  
 my $cumcount=0;  
 open CUTSITES, $ARGV[0] or die $!;  
 while($line = <CUTSITES>){  
 chomp $line;  
 my @header = split /\t/, $line;  
 $cumlen{$header[0]}=$cumcount;  
 $cumcount=$cumcount+$header[1];  
 }  
 close CUTSITES;  
 open MAPSITES, $ARGV[1] or die $!;  
 while($line = <MAPSITES>){  
 chomp $line;  
 my @header = split /\t/, $line;  
 my $start=$header[1]+$cumlen{$header[0]};  
 my $end=$header[2]+$cumlen{$header[0]};  
 print "Map\t$start\t$header[3]\n";  
 print "Map\t$end\t$header[3]\n";  
 print "Map\tNA\tNA\n";  
 }  
 close MAPSITES;  
The figure below shows the dotplot of the Optical map created using above scripts with a search radius of 200 base pairs. Increasing the search radius saturates the plot while allowing for more distant hits.

Friday, August 22, 2014

Merge multiple kmer count hashes into one

A previous attempt at merging two kmer count hashes was neither memory efficient nor capable of merging multiple kmer count hashes. Here, we use the age old trick of sorting to write a more memory efficient script that can handle as N number of hashes.


 cat *_"$kmer"_counts.fa|sort > sorted_"$kmer"_all.fa  

The above command will concatenate all the hashes and sort it. This sorted file can then be used by the below perl script to merge the hashes. Since, all kmers that need to be merged are in adjacent lines, the memory needed for merging is drastically reduced compared to the previous script.


 #!/usr/bin/perl  
 use warnings;  
 # Input parameters  
 open FASTA1, $ARGV[0] or die $!;  
 my $previous="Kmer";  
 my $previousCount="Kmercount"; 
 my @jelly;
  while($line = <FASTA1>){  
 chomp $line;  
 @jelly=split(/\s+/,$line);  
      if($previous=~/$jelly[0]/){  
      $previousCount=$previousCount+$jelly[1];  
      }  
      else{  
      print "$previous\t$previousCount\n";  
      $previous=$jelly[0];$previousCount=$jelly[1];  
      }  
 }  
      #printing last line if it needed merging  
      if($previous=~/$jelly[0]/){  
      print "$previous\t$previousCount\n";  
      }  
 close FASTA1;  

Friday, March 21, 2014

Perl script to get fasta sequences longer than a certain length

 #!/usr/bin/perl  
 use strict;  
 use warnings;  
 # Input parameters  
 open FASTA, $ARGV[0] or die $!;  
 my $seqst_temp="";  
 my $seqs = {GENENAME =>my $genename,LEN =>my $qcom};  
 my $iso="";  
 my $minval=$ARGV[1];  
 while($line = <FASTA>){  
 if($line=~ /^>/){  
 if($header){  
 $seqs{$seqst_temp}{GENENAME}=$header;  
 $seqs{$seqst_temp}{LEN}=length $seqst_temp;  
 }  
 chomp $line;  
 $header="";  
 $header=$line;  
 $seqst_temp="";  
 }  
 else{  
 $line =~ s/[\n\t\f\r_0-9\s]//g;  
 $seqst_temp .= $line;  
 }  
 }#end of while loop  
 if($header){  
 $seqs{$seqst_temp}{GENENAME}=$header;  
 $seqs{$seqst_temp}{LEN}=length $seqst_temp;  
 }  
 close FASTA;  
 foreach $iso (sort keys %seqs) {  
      if($seqs{$iso}{LEN} > $minval){  
      print "$seqs{$iso}{GENENAME}\n";  
      print "$iso\n";  
      }  
 }  

Example: perl getlongerthan.pl genome.fasta 100 > longerthan.100.fasta

Wednesday, January 22, 2014

Nth order Markov chain in perl given stationary distribution and transition probability matrix

A Markhov chain can be simulated given a transition probability matrix.

 #!/usr/bin/perl  
 use warnings;  
 use strict;  
 open MODELS, $ARGV[0] or die $!;  
 my $cyclestorun=20;  
 my %model=();  
 my $line = <MODELS>;chomp $line;  
 my @headers=split(/\t/,$line);  
 my @values="";  
 my @stationVals;  
 my @stationDist;  
 my $check=0;  
 my $rnd=0;  
 my $test=0;  
 my $index=0;  
 my $startval="";  
 my $preval="";  
 my $nextval="";  
 my $i=0;  
 my $j=0;  
 my $stat=0;  
 my $presub="";  
 while($line = <MODELS>){  
      chomp $line;@values=split(/\t/,$line);$check=0;  
      push(@stationVals,$values[0]);  
      push(@stationDist,$values[1]);  
      for($i=2;$i<scalar @headers;$i++){  
      $check+=$values[$i];  
      if($check>1){print "Error in Transition probability matrix in line: $line\n";exit;}  
      $model{$values[0]}{$headers[$i]}=$values[$i];  
 #     print "$values[0]\t$headers[$i]\t$model{$values[0]}{$headers[$i]}\n";  
      }  
 }#end of while loop  
 close MODELS;  
      print "\t\t\tInitialising stationary distribution\n\n\n";  
 $check=0;  
 foreach $stat(@stationDist){  
      $check+=$stat;  
      if($check>1){print "Error in Stationary distribution.Probability greater than 1!\n";exit;}  
 }  
 $rnd=rand(1);  
 $test=0;  
 foreach $stat(@stationDist){  
      $test+=$stat;  
      if($rnd<$test){  
      $startval=$stationVals[$index];  
      #exit the foreach loop  
      $test=-100;  
      }  
 $index++;  
 }  
      print "\t\tInitial step\t$rnd\t$startval\n\n";  
 $preval=$startval; $test=0;  
 for($j=1;$j<=$cyclestorun;$j++){  
      $test=0;$rnd=rand(1);  
      for($i=2;$i<scalar @headers;$i++){  
      $test+=$model{$preval}{$headers[$i]};  
           if($rnd<$test){  
           $nextval=$headers[$i];  
           #exit the foreach loop  
           $test=-100;  
           }  
      }  
      if((length $preval)>1){$presub=substr $preval,1,1;}  
      $preval=$presub . $nextval;  
      print "\t\t$j\t$rnd\t$preval\n";  
 }#end of cyclestorun loop  

Example cases:

First order Markhov chain:
The "stat" column corresponds to the stationary matrix.

Model:
      stat     A     G     T  
 A     0.1     0.1     0.5     0.4  
 G     0.5     0.9     0.1     0  
 T     0.4     0.3     0.3     0.4  

Output:

 perl markhov.pl Markhov1.model  
                Initialising stationary distribution  
           Initial step     0.566160679402859     G  
           1     0.726538222140761     A  
           2     0.307280103481514     G  
           3     0.892182052225458     A  
           4     0.336793610721617     G  
           5     0.205083725028075     A  
           6     0.523360180106774     G  
           7     0.376126474509043     A  
           8     0.385466656638901     G  
           9     0.357110639627308     A  
           10     0.940985077542603     T  
           11     0.567528252945955     G  
           12     0.215130112396754     A  
           13     0.737550170708133     T  
           14     0.372513088005231     G  
           15     0.87686981502349     A  
           16     0.534856061888437     G  
           17     0.94194553431501     G  
           18     0.800215938891096     A  
           19     0.990931721477871     T  
           20     0.371922711443307     G  

Second order Markhov chain:

Model:
      stat     A     G     T  
 AA     0.1     0.1     0.5     0.4  
 AG     0.05     0.9     0.1     0  
 AT     0.04     0.3     0.3     0.4  
 GA     0.2     0.1     0.5     0.4  
 GG     0.1     0.9     0.1     0  
 GT     0.1     0.3     0.3     0.4  
 TA     0.1     0.1     0.5     0.4  
 TG     0.1     0.9     0.1     0  
 TT     0.2     0.3     0.3     0.4  

Output:

 perl markhov.pl Markhov2.model  
                Initialising stationary distribution  
           Initial step     0.625368699737923     TA  
           1     0.590942442973272     AG  
           2     0.0483144526753101     GA  
           3     0.0103876021193585     AA  
           4     0.367650618439331     AG  
           5     0.973362473523579     GG  
           6     0.310508404063821     GA  
           7     0.890260746277896     AT  
           8     0.4738624084188     TG  
           9     0.158245684870735     GA  
           10     0.295448727223441     AG  
           11     0.33900585792933     GA  
           12     0.988197918079994     AT  
           13     0.366480732651112     TG  
           14     0.229562890090616     GA  
           15     0.543711924314373     AG  
           16     0.114082525688733     GA  
           17     0.850092575768059     AT  
           18     0.546652122930436     TG  
           19     0.715004225102355     GA  
           20     0.20491958253287     AG  

Any number of states can be added, as well as any order can be simulated.

Zero-order:

Model:
      stat     A     G     T  
 A     0.33     0.33     0.33     0.33  
 G     0.33     0.33     0.33     0.33  
 T     0.33     0.33     0.33     0.33  

Output:
 perl markhov.pl Markhov0.model  
                Initialising stationary distribution  
           Initial step     0.804352114516409     T  
           1     0.967022104046436     T  
           2     0.146048431090218     A  
           3     0.168446080849158     A  
           4     0.806730437919288     T  
           5     0.0541887571889532     A  
           6     0.90109841189982     T  
           7     0.815255933249396     T  
           8     0.647698135106484     G  
           9     0.93008693266961     T  
           10     0.721468943653047     T  
           11     0.311067960681136     A  
           12     0.231977046730197     A  
           13     0.251340034965111     A  
           14     0.140686836632536     A  
           15     0.0760768098699529     A  
           16     0.182739903656344     A  
           17     0.496555550139448     G  
           18     0.219248000363631     A  
           19     0.163342643602853     A  
           20     0.994710285749438     A  
And now to use it in a real world application....any suggestions?

Monday, January 20, 2014

Perl script to print codon usage per sequence in multi-fasta file

 #!/usr/bin/perl  
 open GENES, $ARGV[0] or die $!;  
 my @bases = ("A", "T", "C", "G");  
 my %ctable=();  
 my %genes=();  
 while($line = <GENES>){  
 if($line=~ /^>/){  
           if($header){  
           $genes{$header}=$seqst_temp;  
           }  
      chomp $line;  
      $line =~ s/\>//g;  
      $header="";  
      $header=$line;  
      $seqst_temp="";  
      }  
      else{  
      $line =~ s/[\n\t\f\r_0-9\s]//g;  
      $seqst_temp .= $line;  
      }  
 }#end of while loop  
 if($header){  
 $genes{$header}=$seqst_temp;  
 }  
      foreach $base1 (@bases){  
      foreach $base2 (@bases){  
      foreach $base3 (@bases){  
      #print "$base1\t$base2\t$base3\n";  
      my $codon="$base1" . "$base2" . "$base3";  
      #populate all possible codons  
      $ctable{$codon}=0;  
      }}}  
 #header  
 print "Genename\t";foreach $key (sort keys %ctable) {print "$key\t";}print "\n";  
 foreach $genekey (sort keys %genes) {  
 print "$genekey\t";  
 @gcodons = ( $genes{$genekey} =~ m/.../g );  
      foreach $base1 (@bases){  
      foreach $base2 (@bases){  
      foreach $base3 (@bases){  
      #print "$base1\t$base2\t$base3\n";  
      my $codon="$base1" . "$base2" . "$base3";  
      #populate all possible codons  
      $ctable{$codon}=0;  
      }}}  
      foreach $gcodon (@gcodons) {  
 #print "$gcodon\n";  
      if(exists $ctable{$gcodon}){$ctable{$gcodon}++;}  
      }  
      foreach $key (sort keys %ctable) {  
         print "$ctable{$key}\t";  
      }  
      print "\n";  
 }#end genes foreach  
 close GENES;  

Saturday, January 11, 2014

VCF to calls format

Perl script that reads through a VCF file and prints it out in the "calls" format.

Although i could not find any proper documentation for the calls format, it can be described as diploid genotype calls represented using ambiguous DNA bases for each individual with the first line being the individual id's or names and the following lines being the genotypes at different positions.

 #!/usr/bin/perl  
 use List::Util qw[min max];  
 # Input parameters  
 my $vcf_file = $ARGV[0];  
 #Go through fasta file, extract sequences  
 open(IN, $vcf_file);  
 while($z=<IN>) {  
      if($z=~m/^##/){}  
      elsif($z=~m/^#/){  
           print "scaffold\tposition";  
           chomp $z;  
           @values=split(/\t/,$z);  
           $totind=scalar @values;  
           for($i=9;$i<$totind;$i++){  
           print "\t$values[$i]";  
           }  
      print "\n";  
      }  
      else{  
           chomp $z;  
           @values=split(/\t/,$z);  
           $refbase=$values[3];  
           $altbase=$values[4];  
                if(length $altbase < 2){#skip tri-allelic sites  
                     print "$values[0]\t$values[1]";  
                     $totind=scalar @values;  
                     for($i=9;$i<$totind;$i++){  
                     @parts=split(/\:/,$values[$i]);  
                $parts[0] =~ s/\///g;$parts[0] =~ s/0/$refbase/g;$parts[0] =~ s/1/$altbase/g;  
                $parts[0] =~ s/[A][A]/A/ig;$parts[0] =~ s/[T][T]/T/ig;$parts[0] =~ s/[C][C]/C/ig;$parts[0] =~ s/[G][G]/G/ig;$parts[0] =~ s/[.][.]/N/g;  
                $parts[0] =~ s/[AT][AT]/W/ig;$parts[0] =~ s/[GT][GT]/K/ig;$parts[0] =~ s/[AC][AC]/M/ig;$parts[0] =~ s/[AG][AG]/R/ig;$parts[0] =~ s/[CT][CT]/Y/ig;$parts[0] =~ s/[CG][CG]/S/ig;  
                     print "\t$parts[0]";  
                     }  
           print "\n";  
           }  
      }  
 }#end of file while  
 close IN;  
 #perl vcftocalls.pl genotyped.vcf > genotyped.calls  

Monday, June 10, 2013

Randomise order of lines in a file

Different programming languages are good at different things. R has many powerful statistical functions, while perl is good at data handling.

N random numbers from a certain range of numbers without re-sampling can be easily done in R with the "sample" function. To do the same thing in Perl, looping has (or atleast some form of iteration) to be used along with storing the results and checking to avoid re-sampling. 
 args<-commandArgs(TRUE)  
 totalsnps<-as.integer(args[1])  
 runumber<-as.integer(args[2])  
 sample(1:totalsnps,totalsnps,replace=F)->N  
 write.table(file=paste("rands.out",runumber,sep="."),N,col.names=F,row.names=F,quote=F)  

This Rscript can be run using the below line

 Rscript sampleit.r $linecount $iterationcount  

Once, the file with the new order of lines has been generated, it can be used by the perl script to write the file in the new order. We also keep the first two columns of the file unchanged and just randomise the remaining parts of the file.


 #!/usr/bin/perl  
 open RANDS, $ARGV[1] or die $!;  
 my %rhash = ();  
 my $count=1;  
#read in the file created by the R script in previous step
 while($lines = <RANDS>){  
 chomp $lines;  
 $rhash{$count}=$lines;  
 $count++;  
 }  
 close RANDS;  
#read the file that needs to be randomised and store it in hash with new order
 open STATS, $ARGV[0] or die $!;  
 my $hash = {CHR =>my $genename,POS =>my $pid,RESTATS =>my $pco1};  
 $mycount=1;  
 while($line = <STATS>){  
 chomp $line;  
 @tabs=split(/[ \t]+/,$line);  
 $hash{$mycount}{CHR}=$tabs[0];  
 $hash{$mycount}{POS}=$tabs[1];  
 $line =~ m/\w*\t\w*\t(.*)$/;  
 $hash{$rhash{$mycount}}{RESTATS}=$1;  
 $mycount++;  
 }#end of file while loop  
#check if number of lines match in old and new file
 if($mycount!=$count){print "mismatch in counts\n";}  
#print the file out in new order
 foreach $contigs (sort { $a <=> $b } keys %hash) {   
 print "$hash{$contigs}{CHR}\t$hash{$contigs}{POS}\t$hash{$contigs}{RESTATS}\n";   
 }  

This perl script just reads in the input file, stores it in a hash with new line order and then prints it out.

Sunday, May 26, 2013

Get gene start and end from GTF file

In a GTF file that does not have CDS records annotated, its tricky to get the start and end coordinates of a gene. This script does just that and prints a nice BED format file. It also report the genes that occur on multiple scaffolds or chromosomes as errors. These can be greped out using grep -v "Error".
 #!/usr/bin/perl  
 my $gtf1 = $ARGV[0];  
 my %scaf=();  
 my $start=();  
 my %end=();  
 my %multi=();  
 open(GTF1, $gtf1);  
 while($z=<GTF1>){   
 chomp $z;  
 my @parts=split(/\t/,$z);  
 my $start=$parts[3];  
 my $end=$parts[4];  
 my @parts2=split(/\s/,$parts[8]);  
 my $gene=$parts2[1];  
 $gene=~s/[\;\"]//g;  
 ##print "$gene\t$start\t$end\n";  
 if(!(exists $scaf{$gene})){$scaf{$gene}=$parts[0];}  
 elsif(!($scaf{$gene}=~m/$parts[0]/)){$multi{$gene}=1;}  
 if(!(exists $start{$gene})){$start{$gene}=$start;$end{$gene}=$end;}  
 else{$end{$gene}=$end;}  
 }  
 close(GTF1);  
 foreach my $keygene(sort keys %scaf){  
 if($start{$keygene}>$end{$keygene}){$temp=$start{$keygene};$start{$keygene}=$end{$keygene};$end{$keygene}=$temp;}  
 if(!(exists $multi{$keygene})){print "$scaf{$keygene}\t$start{$keygene}\t$end{$keygene}\t$keygene\n";}  
 else{print "Error:Gene $keygene on mutiple scaffolds\n";}  
 }  

Saturday, May 25, 2013

Perl script to filter sites with more than 50 percent sites missing by population

In certain cases, its required to have sites from a VCF file filtered by fraction of genotypes missing by population. While entire sites can be filtered using programs like VCFtools, its not possible to filter them by population. Here its assumed that all individuals from $ARGV[1] to $ARGV[2] are in one population and those from $ARGV[3] to $ARGV[4] are in another.

 #!/usr/bin/perl  
 use List::Util qw[min max];  
 # Input parameters  
 my $vcf_file = $ARGV[0];  
 my $firstmissing=0;  
 my $firstall=$ARGV[2]-$ARGV[1];  
 my $secondmissing=0;  
 my $secondall=$ARGV[4]-$ARGV[3];  
 #Go through fasta file, extract sequences  
 open(IN, $vcf_file);  
 while($z=<IN>) {  
 $firstmissing=0;  
 $secondmissing=0;  
      if($z=~m/^#/){print $z;}  
      else{  
           chomp $z;  
           @values=split(/\t/,$z);  
      $totind=length @values;  
      for($i=$ARGV[1];$i<=$ARGV[2];$i++){if($values[$i]=~m/\.\/\./){$firstmissing++;}}  
      for($i=$ARGV[3];$i<=$ARGV[4];$i++){if($values[$i]=~m/\.\/\./){$secondmissing++;}}  
 if((($secondmissing/$secondall)<0.5)&&(($firstmissing/$firstall)<0.5)){print "$z\n";}  
      }#end of else #  
 }#end of file while  
 close IN;  

Monday, May 20, 2013

Combining SNP data tables with perl

Continuing with our previous exploits Analyzing in vitro toxicity and expression data, its time to combine SNP data tables using perl.

#!/usr/bin/perl

open CANFAM2, $ARGV[0] or die $!;
open CANFAM3, $ARGV[1] or die $!;

%can2=();
%can3=();

while($line = <CANFAM2>){
chomp $line;
@tabs=split(/\s+/,$line);$tabs[9]=~s/[\;\"]//g;$tabs[11]=~s/[\;\"]//g;
$key=$tabs[9];
$value=$tabs[0] . "_" . $tabs[3] . "_" . $tabs[11];

if(exists $can2{$key}){print "Error:Duplicate record for SNP_ID $tabs[9]. Skipping second occurence.\n";}
else{$can2{$key}=$value;}

}#end of file while loop

while($line = <CANFAM3>){
chomp $line;
@tabs=split(/\s+/,$line);$tabs[9]=~s/[\;\"]//g;$tabs[11]=~s/[\;\"]//g;
$key=$tabs[9];
$value=$tabs[0] . "_" . $tabs[3] . "_" . $tabs[11];


if(exists $can3{$key}){print "Error:Duplicate record for SNP_ID $tabs[9]. Skipping second occurence.\n";}
else{$can3{$key}=$value;}

}#end of file while loop


print "SNP_ID\tbases\tchr_canfam2\tpos_canfam2\tchr_canfam3\tpos_canfam3\tdistance_between_versions\n";
$transitions=0;
$transversions=0;

foreach $mykey(sort keys %can2){
@can2tabs=split(/\_/,$can2{$mykey});

if($can2tabs[2]=~m/(AG|GA|CT|TC)/){$transitions++;}
elsif($can2tabs[2]=~m/(AC|CA|GT|TG)/){$transversions++;}

    if(exists $can3{$mykey}){
        @can3tabs=split(/\_/,$can3{$mykey});
            if($can2tabs[0]=~m/$can3tabs[0]/){$distance=abs($can2tabs[1]-$can3tabs[1]);}else{$distance="NA";}
        print "$mykey\t$can2tabs[2]\t$can2tabs[0]\t$can2tabs[1]\t$can3tabs[0]\t$can3tabs[1]\t$distance\n";
    }
    else {
    print "Error:SNP_ID $mykey missing in canfam3.\n";
    print "$mykey\t$can2tabs[2]\t$can2tabs[0]\t$can2tabs[1]\tNA\tNA\tNA\n";
    }
}

foreach $mykey(sort keys %can3){
    if(!(exists $can2{$mykey})){
    print "Error:SNP_ID $mykey missing in canfam2.\n";
    @can3tabs=split(/\_/,$can3{$mykey});
    print "$mykey\t$can3tabs[2]\tNA\tNA\t$can3tabs[0]\t$can3tabs[1]\tNA\n";

    if($can3tabs[2]=~m/(AG|GA|CT|TC)/){$transitions++;}
    elsif($can3tabs[2]=~m/(AC|CA|GT|TG)/){$transversions++;}
    }
}
$titv=$transitions/$transversions;
print "Info: $transitions Transistions\n";
print "Info: $transversions Transversions\n";
print "Info: $titv Ti/Tv ratio\n";

close CANFAM2;
close CANFAM3;


To do something bonus, lets calculate transitions and transversions to infer the Ti/Tv ratio.


Info: 1852527 Transistions
Info: 504318 Transversions
Info: 3.67333111251234 Ti/Tv ratio

Apart from this, 39,352 SNP's were found in only one of the two versions of the assembly. These could be attributed to gaps in the assembly that were filled at a later stage by Illumina sequencing. 

Sunday, May 19, 2013

Toxicity and expression data project

One possible solution to Analyzing in vitro toxicity and expression data perl project. Example table that is used as input to the perl script is given in below table.


"source_name_sid""casrn""chemical_name""assay_component_name""conc""value""value_type""plate_id""rep""row""col""target""time_hr""reference""media_reference""donor"
"DSSTOX_40294""135158-54-2""Acibenzolar-S-Methyl""CLZD_ABCB1_6"0.0041.08"fold_change"11310"E"5"ABCB1"6300.5345.75778
"DSSTOX_40294""135158-54-2""Acibenzolar-S-Methyl""CLZD_ABCB1_6"0.0040.96"fold_change"11310"F"5"ABCB1"6300.5345.75778
"DSSTOX_40294""135158-54-2""Acibenzolar-S-Methyl""CLZD_ABCB1_6"0.0040.94"fold_change"11310"G"5"ABCB1"6300.5345.75778
"DSSTOX_40294""135158-54-2""Acibenzolar-S-Methyl""CLZD_ABCB1_6"0.0040.93"fold_change"11310"H"5"ABCB1"6300.5345.75778
"DSSTOX_40294""135158-54-2""Acibenzolar-S-Methyl""CLZD_ABCB1_6"0.040.94"fold_change"1138"G"4"ABCB1"6300.5345.75778
"DSSTOX_40294""135158-54-2""Acibenzolar-S-Methyl""CLZD_ABCB1_6"0.041.13"fold_change"1138"E"4"ABCB1"6300.5345.75778
"DSSTOX_40294""135158-54-2""Acibenzolar-S-Methyl""CLZD_ABCB1_6"0.040.96"fold_change"1138"H"4"ABCB1"6300.5345.75778
"DSSTOX_40294""135158-54-2""Acibenzolar-S-Methyl""CLZD_ABCB1_6"0.041.07"fold_change"1138"F"4"ABCB1"6300.5345.75778
"DSSTOX_40294""135158-54-2""Acibenzolar-S-Methyl""CLZD_ABCB1_6"0.41.02"fold_change"1136"F"3"ABCB1"6300.5345.75778

Actual perl code:
#!/usr/bin/perl

open TOXTABLE, $ARGV[0] or die $!;

%gcct=();

while($line = <TOXTABLE>){
chomp $line;
@tabs=split(/\t/,$line);

$key=$tabs[2] . "_" . $tabs[4] . "_" . $tabs[11] . "_" . $tabs[12];
$foldchange=$tabs[5];

if(exists $gcct{$key}){if($gcct{$key}<$foldchange){$gcct{$key}=$foldchange;}}
else{$gcct{$key}=$foldchange;}

}#end of file while loop

print "chemical_name\tconctarget\ttime_hr\tvalue\n";

foreach $mykey(sort keys %gcct){
@mytabs=split(/\_/,$mykey);
print "$mytabs[0]\t$mytabs[1]\t$mytabs[2]\t$mytabs[3]\t$gcct{$mykey}\n";
}


Just run the perl script with the filename of the table as first argument and it will print "which chemical compound and at what concentration causes the highest fold change of transcription in each gene at each timepoint".

The same can be done with one line in R using :


 aggregate(M$value,by=list(M$chemical_name,M$conc,M$target,M$time_hr),max)->N  

Tuesday, September 4, 2012

Get duplicate fasta sequences

ALLPATHS-LG had the DEDUP option turned off by default prior to release 42726. So this bit of code identifies exact duplicates either on the same or negative strand. Many of my runs had 30 to 60 Kb of sequence that was duplicated with almost equal amounts on both strands.

 #!/usr/bin/perl  
 use warnings;  
 # Input parameters  
 open FASTA, $ARGV[0] or die $!;  
 my $seqst_temp="";  
 my $seqs = {GENENAME =>my $genename,LEN =>my $qcom};  
 while($line = <FASTA>){  
 if($line=~ /^>/){  
 if($header){  
 if(exists $seqs{$seqst_temp}{GENENAME}){print "$seqs{$seqst_temp}{GENENAME}\t$header\t$seqs{$seqst_temp}{LEN}\n";}  
 $rseqst_temp = $seqst_temp;  
 $rseqst_temp=revcomp($rseqst_temp);  
 if(exists $seqs{$rseqst_temp}{GENENAME}){print "$seqs{$rseqst_temp}{GENENAME}\t$header\t$seqs{$rseqst_temp}{LEN}\treverse\n";}  
 $seqs{$seqst_temp}{GENENAME}=$header;  
 $seqs{$seqst_temp}{LEN}=length $seqst_temp;  
 }  
 chomp $line;  
 $header="";  
 $header=$line;  
 $seqst_temp="";  
 $rseqst_temp="";  
 }  
 else{  
 $line =~ s/[\n\t\f\r_0-9\s]//g;  
 $seqst_temp .= $line;  
 }  
 }#end of while loop  
 if($header){  
 if(exists $seqs{$seqst_temp}{GENENAME}){print "$seqs{$seqst_temp}{GENENAME}\t$header\t$seqs{$seqst_temp}{LEN}\n";}  
 $rseqst_temp = $seqst_temp;  
 $rseqst_temp=revcomp($rseqst_temp);  
 if(exists $seqs{$rseqst_temp}{GENENAME}){print "$seqs{$rseqst_temp}{GENENAME}\t$header\t$seqs{$rseqst_temp}{LEN}\treverse\n";}  
 $seqs{$seqst_temp}{GENENAME}=$header;  
 $seqs{$seqst_temp}{LEN}=length $seqst_temp;  
 }  
 close FASTA;  
 sub revcomp{  
     my $input = shift;  
     my $revcomp = reverse($input);  
     $revcomp =~ tr/ACGTacgt/TGCAtgca/;  
     return $revcomp;  
 }  

Although this does the job, its ugly in having the same bit of code used twice, once within the loop and once after the while loop. May be the end of file can be handled more elegantly.

Wednesday, March 28, 2012

MD5 file list checker

This program reads a file with filenames with correct path and MD5 values separated by a tab character and checks if the MD5 is correct or not.

#!/usr/bin/perl
use strict;
use Digest::MD5 qw(md5_base64);

open MD5, $ARGV[0] or die $!;
my $line="";
while($line = ){
chomp $line;
my @files=split(/[ \t]+/,$line);
open(FILE, $files[1]) or die "Can't find file $files[1]\n";
my $digobj = Digest::MD5->new;
$digobj->addfile(*FILE);
$digest = $digobj->hexdigest;
close(FILE);
if($digest!~m/$files[0]/){print "Md5 does not match for file:" . $files[1];}
else{
print "Md5 match for file:$files[1]\n";
print $digest ."\n" . $files[0] . "\n";
}
}

It would make sense to have MD5 checks integrated into the OS and have a MD5 list in each folder. May be it will get added into the code of various programs like ftp, sftp or even ordinary copy and mv.

Sort fasta file

Many programs like GATK require the fasta files to be sorted before use. Here is a rather simple script for the job:

 #!/usr/bin/perl  
 open FASTA, $ARGV[0] or die $!;  
 my $temp="";  
 my $seqs = {SEQ =>my $fheader};  
 my $sortemp="";  
 while($line = <FASTA> ){  
 if($line=~ /^>/){  
 if($header){$seqs{$header}{SEQ}=$temp;}  
 chomp $line;  
 $header="";  
 $line =~ s/[\s]/_/g;  
 $header=$line;  
 $temp="";  
 }  
 else{$line =~ s/[\n\t\f\r_0-9\s]//g;$temp .= $line;}  
 }#end of while loop  
 if($header){$seqs{$header}{SEQ}=$temp;}  
 close FASTA;  
 foreach $sortemp (sort keys %seqs) {  
 print "$sortemp\n";  
 print "$seqs{$sortemp}{SEQ}\n";  
 }  

However, you can find more elegant solutions that use Bioperl at Wolf/Takebayashi lab.

Thursday, March 3, 2011

Break scaffolds into Mate pairs

Could not find any programs that can merge a set of scaffolds. Hence, decided to break the scaffolds into mate pairs and use those for scaffolding. Below is a simple perl script to break scaffolds into all possible mate pairs in a format suitable for SSPACE (a hierarchical scaffolder). It can easily be modified to work for BAMBUS or any other scaffolder or assembler.


#!/usr/bin/perl

#AUTHOR
# Nagarjun Vijay (c) 2011
# mate maker.pl - program to break scaffolds into mate pairs
#

#DATE
# 3rd March 2011
#

use strict;

my $scafile=$ARGV[0];

#reading the scaffold sequences
open SCAF, "<",$scafile or die $!;

#open contigs file
open CONTIG, ">>",$scafile . ".contigs.fa" or die $!;


#open contigs file
open LIB, ">>",$scafile . ".lib" or die $!;

my ($scaffoldcount,$seqst_temp,$contigcount,$notscaffoldcount,$z,$head,$i,$j,$libcount);
$scaffoldcount=0,$seqst_temp="",$contigcount=0,$notscaffoldcount=0,$libcount=0;
my $header = ;#reading the first header

while($z = ){
if($z=~ />/)
{
#split scaffold into contigs
if($seqst_temp=~ m/[N]+/){#is really a scaffold
$scaffoldcount++;
$contigcount +=SplitScaffold($seqst_temp);
}#end of scaffold check if
else{#not a scaffold - so not writing into breaker file
$head=">unbreak";
$notscaffoldcount++;
print CONTIG $head . "" . $notscaffoldcount ."\n";
print CONTIG "$seqst_temp\n";
}#end of scaffold check else

#next sequence
$seqst_temp="";
}
else
{
$z =~ s/[\n\t\f\r_0-9\s]//g;
$seqst_temp .= $z;
}
}#end of File while loop

if($seqst_temp=~ m/[N]+/){#is really a scaffold
$scaffoldcount++;
$contigcount +=SplitScaffold($seqst_temp);
}#end of scaffold check if
else{#not a scaffold - so not writing into breaker file
$head=">unbreak";
$notscaffoldcount++;
print CONTIG $head . "" . $notscaffoldcount ."\n";
print CONTIG "$seqst_temp\n";
}#end of scaffold check else
close SCAF;
close CONTIG;

#Split scaffolds, write contigs and breaker file
sub SplitScaffold{
my $seq = shift;
my ($head,$num,$contigs,$n);
$head=">breaker$scaffoldcount";
$num=1,$contigs=1;
my @values=split(/([N]+)/,$seq);
my $vallen= scalar (@values);
for($i=0;$i<$vallen;$i++) {
my $val=$values[$i];
if(($num % 2) == 0){
$n = length $val;
}
else{
print CONTIG $head . "" . $contigs ."\n";
print CONTIG "$val\n";
$contigs++;
my $matedist=(length $values[$i])+(length $values[$i+1])+(length $values[$i+2]);
for($j=$i+2;$j<$vallen;$j=$j+2){
print LIB "lib".$libcount." l".$libcount."s".$scaffoldcount."b".$i.".fasta l".$libcount."s".$scaffoldcount."b".$j.".fasta ".$matedist." 0.75 0\n";
$matedist=$matedist+(length $values[$j+1])+(length $values[$j+2]);
open READ1, ">>","l".$libcount."s".$scaffoldcount."b".$i.".fasta" or die $!;
open READ2, ">>","l".$libcount."s".$scaffoldcount."b".$j.".fasta" or die $!;
print READ1 ">l".$libcount."s".$scaffoldcount."b".$i."\n";
print READ1 $values[$i]."\n";
print READ2 ">l".$libcount."s".$scaffoldcount."b".$j."\n";
print READ2 reverseComplement($values[$j])."\n";
close READ1;
close READ2;
$libcount++;
}

}
$num++;
}

return $contigs;
}
#reverse complement a sequence
sub reverseComplement{
$_ = shift;
tr/ATGC/TACG/;
return (reverse());
}
#end of Breaker

Tuesday, February 22, 2011

convert Fasta files into TIGR .contig file

During the process of converting Fasta files with gaps to AFG format, one step required generation of TIGR .contig format. Given below is a simple script to generate a dummy .contig file which has just one read for each contig which is exactly the same as the contig. This is done due to the lack of read tracking in SOAP, SSPACE etc. and also to avoid the huge file size if all the reads are retained.

 #!/usr/bin/perl  
 open FASTA, "< $ARGV[0]" or die "Can't open $ARGV[0] ($!)\n";  
 while($z=<FASTA>){  
  if($z=~ />/)  
  {  
  chomp $z;  
  $header=(split(/>/,$z))[1];  
  $readid=(split(/_/,$header))[1];  
  $seq=;  
  chomp $seq;  
  $seqlen=length $seq;  
  print "##$header 1 $seqlen bases, 00000000 checksum.\n";  
  print "$seq\n";  
  print "#$readid(0) [] $seqlen bases, 00000000 checksum. {$seqlen 0} <1>\n";  
  print "$seq\n";  
  }  
 }  

save it as fasta2contig.pl and use as "perl fasta2contig.pl contig.fa"

Wednesday, December 1, 2010

Program to shred contigs into reads with overlap

Most assembly programs seem to have some limit on the length of the reads that they take as input for assembling them. Assembling contigs can be a difficult problem in such cases. Shredding the contigs into smaller reads with a 50% or more of overlap should retain the benefit of having assembled the contigs and use it for further assembly.

Here is a small program to shred contigs into 1kb reads with 500 base pair overlap:

#!/usr/bin/perl

open FILE1, $ARGV[0] or die $!;

while($line1 = ){
my $flag=0,$overlap=500,$length=1000;

chomp($line1);

$line2 = ;
$seqlen=length $line2;
chomp($line2);

while(($seqlen-$flag)>$length){
if(($seqlen-($flag+$overlap))<$length){
$length=$seqlen-$flag;
}
$nextseq=substr $line2,$flag,$length;
print $line1.":".$flag."-".($flag+$length)."\n";
print $nextseq."\n";
$flag=$flag+$overlap;

}#end of seqlen while loop


}#end of file while loop

This script works on a multifasta file with header in the first line and the sequence in the second line.