Monday, February 23, 2015

Effect of genotype qaulity on the site frequency spectrum

The below shell script takes vcf file as an argument in the for loop and calculates the allele frequencies using VCFTools. These allele frequencies are used to calculate a folded SFS by taking only the major alleles in the calculation.
 for VCF in vcf_file_name.vcf  
 do  
 mkdir "$VCF".dir  
 cd "$VCF".dir  
 cp ../data/"$VCF" .  
 for GQ in 20 40 60 80  
 do  
 #calculate allele frequencies with VCFtools  
 vcftools --vcf "$VCF" --freq --out test.af --minGQ "$GQ"  
 #Take vcf file and extract columns with allele frequency data, in this case the freq output we want columns five and six  
 cut -f5 test.af.frq > test_col1  
 cut -f6 test.af.frq > test_col2  
 cat test_col1 test_col2 > test_append  
 #removes blank line  
 sed -e '/^ *$/d' test_append > test_append2  
 #get rid of first line and first two characters (a/t/g/c:)  
 sed 1d test_append2 > test_append3  
 cat test_append3 | sed 's/^..//' > FILENAME_AFS  
 #To keep only values below 0.50  
 awk '$NF <0.50' FILENAME_AFS > FILENAME_AFS_50."$GQ"  
 echo "0" >> FILENAME_AFS_50."$GQ"  
 echo "0.1" >> FILENAME_AFS_50."$GQ"  
 echo "0.2" >> FILENAME_AFS_50."$GQ"  
 echo "0.3" >> FILENAME_AFS_50."$GQ"  
 echo "0.4" >> FILENAME_AFS_50."$GQ"  
 echo "0.5" >> FILENAME_AFS_50."$GQ"  
 rm FILENAME_AFS test.af.frq test.af.log test_append test_append2 test_append3 test_col1 test_col2  
 done  
 cp ../makebars.r .  
 Rscript makebars.r  
 cd ..  
 done  

The rscript makebars is used to read in each of the site frequency spectrum's at the different genotype quality thresholds and generate a barplot of the SFS.
 read.table(file="FILENAME_AFS_50.20",header=FALSE)->AF20  
 read.table(file="FILENAME_AFS_50.40",header=FALSE)->AF40  
 read.table(file="FILENAME_AFS_50.60",header=FALSE)->AF60  
 read.table(file="FILENAME_AFS_50.80",header=FALSE)->AF80  
 as.data.frame(table(round(AF20$V1,1)))->A20  
 as.data.frame(table(round(AF40$V1,1)))->A40  
 as.data.frame(table(round(AF60$V1,1)))->A60  
 as.data.frame(table(round(AF80$V1,1)))->A80  
 data.frame(Q20=A20$Freq,Q40=A40$Freq,Q60=A60$Freq,Q80=A80$Freq)->q  
 library(plyr)  
 library(ggplot2)  
 library(reshape)  
 Names=seq(0,0.5,0.1)  
 data=data.frame(cbind(q),Names)  
 data.m <- melt(data, id.vars='Names')  
 cbbPalette <- c("#000000", "#E69F00", "#56B4E9", "#009E73", "#F0E442", "#0072B2", "#D55E00", "#CC79A7")  
 jpeg("barplot.jpeg")  
 ggplot(data.m, aes(Names, value,fill = variable)) + geom_bar(stat="identity",position="dodge")+ xlab("Allele frequency bins") + ylab("Number of sites")  
 dev.off()  
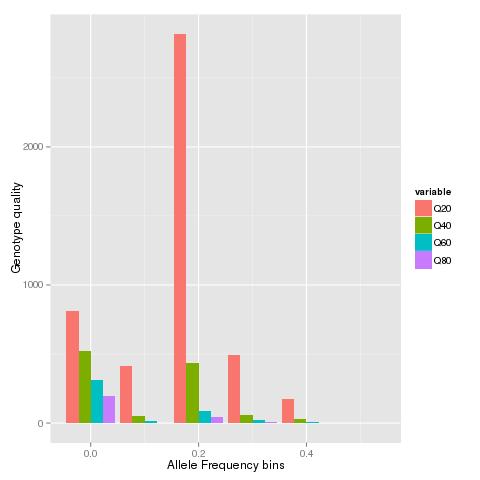
When the VCF file from a published study is run through the script will generate a graph like below:

Friday, February 20, 2015

NOD Mice Substrain Divergence - Runs of Homozygosity

Divergence or rather Differentiation (to use the right terminology), between natural ecotypes or subspecies has been studied in multiple pairs. The broad-scale patterns and underlying processes for such genome wide changes has been studied in detail. 

Do similar processes govern the "divergence" of  artificially inbred strains? Is Drift too strong for background selection to be relevant in such inbred lines? Data [Genetic Analysis of Substrain Divergence in NOD Mice] from a recent study of NOD mice sub-strains might provide some answers. While the study was restricted to sites fixed to homozygosity, it does provide some idea of the major regions that differ between the mouse strains. More detailed analysis of the mouse strains including multiple individuals might be necessary to understand if the diversity landscape of the genome has played any role in shaping the accumulation of genetic differences. 

The Supplementary table 4 provides a list of all the SNP's genotyped using the Mouse Diversity Array. We try to identify runs of homozygosity that share the same genealogy and note if these regions correspond to the deletions identified and validated in the study.


PositionVariants
ChrPos (mm10)Idd.regionSnpIdTypeBomTacMrkTacShiJclShiLtDvsShiLt
114207005JAX00242533G/CGGGCC
139035554Idd26JAX00002691T/-TT-TT
139035867Idd26JAX00247792C/-CC-CC
139035916Idd26JAX00002693A/-AA-AA
139057575Idd26JAX00002694C/-CC-CC
1111005763Idd5.4aJAX00262691A/-A-AAA
1111014417Idd5.4aJAX00262692T/-T-TTT
1111019979Idd5.4aJAX00262694G/-G-GGG
283392830JAX00494876G/---G-G
2131300866Idd13, Idd13-not B2mJAX00503778A/GAAAGA
38893755JAX00514596C/ACCCCA
324286919JAX00516977C/-CCC--
324320030JAX00516979T/-TTT--
324348995JAX00105316A/GAAA--
324383100JAX00516985T/-TTT--
333847305JAX00106024-/GGG-GG
333847927JAX00519037-/TTT-TT
333848126JAX00519038-/AAA-AA
333850816JAX00519044-/CCC-CC
333851250JAX00519045A/-AA-AA
333851593JAX00519046G/-GG-GG
365332947JAX00525208T/CTTTTC
444176075JAX00549396T/ATTTAA
495778743JAX00558533G/AGGGAG
522274118JAX00575925T/CTTTTC
541404231JAX00579937T/-T-TTT
566998537JAX00584961C/ACCCC-
573358239JAX00585757C/TCCCTT
638322613JAX00607572C/TCCCCT
653666162JAX00141075C/-TT-TT
661137631JAX00611572C/TCCCTT
97195978JAX00685032A/GAAAGG
929769301JAX00688769G/CGGGGC
9106903556JAX00704737G/AGGGGA
113243750JAX00023793G/AGGGAA
1239375537JAX00200149G/-G-GGG
13116909804Idd14JAX00371636G/AGGGGA
1532687601JAX00397403C/ACCCCA
1572708061JAX00405386G/AGGGGA
1629905094JAX00416944C/-CC-CC
1690657211JAX00427835G/AGGGAA
1858558824JAX00460581G/TGGGGT
1861847210JAX00461436G/AGGGGA
1866105915Idd21.2JAX00462793G/AGGGAA
1884871118Idd21.1JAX00467924-/TTT---
1950248464JAX00479604C/ACCCCA
X14217495JAX00177287C/ACCCAA
X101602508JAX00716621G/AGGGGA

In the above table the runs of fixed differences and what they are is listed below:


  1. First run (marked in blue) of fixed differences corresponds to the Idd26 locus.
  2. Next is the Idd5 locus. 
  3. The deletion on chromosome 3 spanning 24,272,052 and 24,383,100 has been validated by Sanger sequencing in this study.
  4. The second deletion on chromosome 3 spanning as many as 6 SNP's is located rather close to the first deletion.
The remaining clusters of 2 or 3 sites that share the same genealogy are probably too short to correspond to single events themselves. Nonetheless, it would be interesting to see if these fixed differences are localized to lower nucleotide diversity regions in the initial strains.

Tuesday, February 17, 2015

Bird RNAseq - A thing to watch out for while using the Zebra Finch genome as a reference

Long after our simulation study on RNA-seq, itseems that it is finally time to see some real world use for it. While getting cited many times might suggest some utility for it, being able to actually help real world applications like curing cancer or malaria seems a better reward. 

Downloading a dataset of reads(from a certain bird species) mapped onto the Zebra Finch genome from SRA and calculating the mean mapping quality per gene shows that genes with an Ensemble id greater than ~14,000 have a lower mean mapping quality compared to the rest of the genome. 

This result could potentially be due to the increased mis-mapping seen in our simulation study (see Figure-4). Would discarding multi-mapped reads (zero mapping quality) get rid of this bias? Should this be a issue of major concern? Hopefully, followup studies will appreciate the importance of such bias and try to avoid it or correct for it. 


Monday, February 9, 2015

Ten percent of positively selected variants are within 7 Megabase of the human genome

Ten percent of SNPs that have been found to be positively selected as per the dbPSHP are within a 7 Megabase region on chr 2. This one region is very different from all other regions that have atleast 100 positively selected SNPs in that it has more than 1500 such variants.


1    154500000    167400000    121
10    100100000    113400000    108
12    52200000    62400000    125
14    59800000    70900000    117
15    62900000    79100000    121
17    50350000    64950000    125
18    63400000    67900000    135
2    62400000    75750000    131
2    95500000    101450000    111
2    131100000    137750000    1581
2    175250000    181150000    150
2    194600000    201750000    150
22    28200000    43700000    106
5    9800000    15600000    111
5    106700000    113850000    108
6    25050000    40450000    144
9    97850000    101000000    106
9    122600000    135200000    168

If so many positively selected variants are within such a short distance of each other, can they be considered independent events? Should methods that estimate selection coefficient's consider the cumulative value or just per variant estimates?

Sunday, February 8, 2015

Yet another RAD-seq processing tool when genome is available

This is just a simple set of commands to create a RAD-seq processing tool when the genome is available. Since, it accepts reads mapped to genome in a bam file as input, it is capable of handling RAD-seq, exome sequencing as well as low coverage re-sequencing data. Paired-end as well as single end reads are accepted.

 module load samtools  
 module load BEDTools  

 #calculate per site coverage for each individual bam file  
 samtools depth *.sorted.bam > all.coverage  
 #sum the persite coverage across all individuals  
 awk '{for(i=3;i<=NF;i++) t+=$i; print t; t=0}'|sed 's/ /\t/g' all.coverage > persite.coverage  
 #make a histogram of persite coverage across all individuals  
 cut -f 3 persite.coverage |awk '{counts[$1] = counts[$1] + 1; } END { for (val in counts) print val, counts[val]; }'|sort -k1n,1 > persite.coverage.hist  
 #remove sites with more than 200 reads(as inferred from histogram from previous step) per site  
 awk '{for(i=3;i<=NF;i++) t+=$i; if(t<200)print $0; t=0}'|sed 's/ /\t/g' all.coverage > non.repeat.sites  
 #find sites that have atleast 5 reads in 10 individuals  
 awk '{for(i=3;i<=NF;i++) if($i > 5)t++; if(t>10)print $1,$2,$2,t; t=0}' non.repeat.sites|sed 's/ /\t/g' > wellcovered.sites  
 #collapse sites into loci  
 bedtools merge -i wellcovered.sites > wellcovered.sites.bed  
 #call SNP's for selected loci  
 samtools mpileup -l wellcovered.sites.bed -uf ref.fa *.sorted.bam | bcftools view -bvcg - > var.raw.bcf   
 bcftools view var.raw.bcf | vcfutils.pl varFilter -D100 > var.flt.vcf   

Monday, February 2, 2015

Runs of short exons in Titin gene are conserved across all Mammals

Titin gene more commonly known as Connectin is an elastic muscle protein. The complete gene sequence for this gene has been known since 2001. 

Here we compare the exon structure of Titin transcripts across multiple species with special focus on the cluster of short exons(< 100 bp) in the middle of the gene. Exon ranks of these exons is from ~100 to 180.  These exons correspond to the PEVK segments that are thought to provide the protein "spring" like properties. Comparison of the Titin gene across multiple species has previously been performed across large evolutionary distances. 

All four rodent species [Kangaroo rat (Dipodomys ordii), Mouse (Mus musculus), Pika (Ochotona princeps) and Rabbit(Oryctolagus cuniculus)] from Ensembl show the PEVK exons in phase 1 followed by a pair of 3 exons as seen the human titin gene. 

Mouse
Rabbit
Kangroo Rat
Pika

Similarly, all 12 species from Laurasiatheria[Alpaca (Vicugna pacos), Cat (Felis catus),Cow (Bos taurus), Dog (Canis lupus familiaris), Dolphin (Tursiops truncatus), Ferret (Mustela putorius furo), Hedgehog (Erinaceus europaeus), Horse (Equus caballus), Megabat (Pteropus vampyrus), Microbat (Myotis lucifugus), Panda (Ailuropoda melanoleuca), Sheep (Ovis aries)] also have the PEVK cluster.


Alpaca

Cat
Cow
Dog


Dolphin
Ferret

Horse
Megabat


Microbat


Panda

Sheep
The European Hedgehog has only 30 exons annotated in Ensembl release 78. This might change in later releases. So Functional characterization or some other form of validation is required before considering the possibility of the loss of large number of exons.

All 8 primate genomes [Chimpanzee(Pan troglodytes), Gibbon (Nomascus leucogenys), Gorilla (Gorilla gorilla gorilla), Marmoset (Callithrix jacchus), Olive baboon (Papio anubis), Orangutan (Pongo abelii), Tarsier (Tarsius syrichta) and  Vervet-AGM (Chlorocebus sabaeus)] are very similar to the Human titin. The Gibbon TTN gene is not showing the characteristic run of short exons, but this could be due to the Gibbon genome being relatively new.


Gorilla

Chimp

Gibbon
Marmoset

Olive babbon
Tasrsier
Vervet-AGM

Orangutan


While we have looked at birds before, it has not been a complete coverage. Moreover the ortholog for the TTN gene has been named the SPEG complex locus. So here we use the SPEG complex locus transcripts instead of the transcript from the gene annotated as Titin. We can see that the Chinese Turtle (Pelodiscus sinensis) shows the characteristic pattern of the PEVK exons. However, none of the transcripts annotated in birds [falbicollis_ENSFALG00000003453,ggallus_ENSGALG00000028386,acarolinensis_ENSACAG00000013938,mgallopavo_ENSMGAG00000011306 tguttata_ENSTGUG00000006089]
Chinese Turtle
show the pattern.


Another post dealing with Fish, insects and other species might be able to find other interesting changes in the Titin gene during the course of evolution.


Thursday, January 29, 2015

Mapping centromeres using Optical Map data

Optical mapping has become rather common for applications ranging from genome assembly improvement and validation to structural variation discovery. Validation of the rice genome using Optical map data also helped map centromeres and even span one centromere. However, in some cases centromeres have been found to correspond to regions that have poor mapping of optical maps, presumably due to the presence of tandem repeats that lack unique restriction sites. Without the availability of genetic linkage maps or other evidence, those working with NGS based draft assemblies have speculated that large gaps in the optical map correspond to centromeres or other repeats.

The Human genome has a higher quality as well as availability of various other resources such as genetic linkage maps, BAC's, FISH etc in addition to the availability of optical mapping data. Centromeres have been mapped in the human genome with various other methods and provides an ideal case to investigate the patterns(or lack thereof) shown by optical maps near centromeres. Optical map data for the human and mouse genome from published studies have been made available as bigBed files. This provides a unique resource to understand the behavior of optical maps near centromeres.

First we download the bigBed files for the human genome Hg38 and convert it to bed12 format. This can then be converted to bed format using the convert perl script

 wget ftp://ngs.sanger.ac.uk/production/grit/track_hub/hg38/om_align_GM10860.bigBed  
 wget ftp://ngs.sanger.ac.uk/production/grit/track_hub/hg38/om_align_GM15510.bigBed  
 wget ftp://ngs.sanger.ac.uk/production/grit/track_hub/hg38/om_align_GM18994.bigBed  
 for i in om_align_GM10860 om_align_GM15510 om_align_GM18994  
 do  
 bigBedToBed "$i".bigBed "$i".bed  
 perl convertBed.pl "$i".bed > "$i"_full.bed  
 done  

Perl script called covertBed.pl to convert bed12 to bed format.

 #!/usr/bin/perl  
 my $bed12file = $ARGV[0];  
 open(FILE1, $bed12file);  
      while($header1=<FILE1>) {  
      chomp $header1;  
      my @parts=split(/\t/,$header1);  
      my @parts2=split(/\,/,$parts[10]);  
      my @parts3=split(/\,/,$parts[11]);  
      my $arrSize = @parts2;  
           for($i=0;$i<$arrSize;$i++){  
           $start=$parts[1]+$parts3[$i];  
           $end=$start+$parts2[$i];  
           print "$parts[0]\t$start\t$end\t$parts2[$i]\n";  
           }  
      }  
 close FILE1;  
We next create 50Kb windows across the human genome to analyze the distribution of cut sites in the Optical map.
 mysql --user=genome --host=genome-mysql.cse.ucsc.edu -B -A -D hg38 -e 'select chrom,size from chromInfo' > chromhg38.genome  
 bedtools makewindows -g chromhg38.genome -w 50000|sort -k1,1 -k2,2n > 50kb.wins  
All 3 Optical maps are combined and the mean of the fragment lengths as well their counts are tabulated in 50Kb windows.
 cat *_full.bed|sort -k1,1 -k2,2n > full_all.bed  
 bedtools map -a 50kb.wins -b full_all.bed -c 4 -o mean -null NA > all.mean  
 bedtools map -a 50kb.wins -b full_all.bed -c 4 -o count -null NA > all.count  
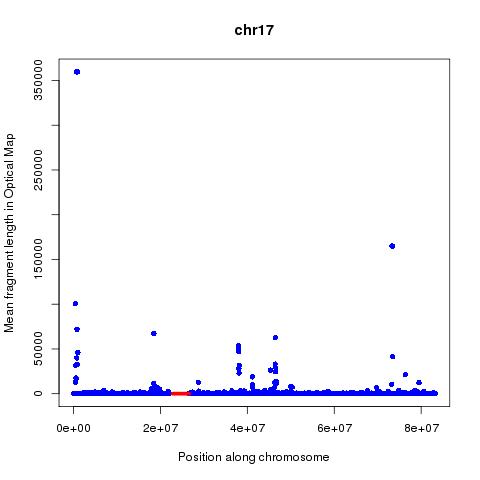
Analysis of these numbers across each chromosome suggests that mean fragment size might be a better predictor of centromeres than the count. The position of the centromeres is obtained from the UCSC tables using below command:

 mysql --user=genome --host=genome-mysql.cse.ucsc.edu -B -A -D hg38 -e 'select chrom,chromStart,chromEnd from centromeres'|grep -v "chromStart" > centromeres.hg38.genome  
Running below R code will create graphical images showing the position of the centromeres by red lines and the mean fragment size by blue dots.
 for (chr in c("chr1","chr2","chr3","chr4","chr5","chr6","chr7","chr8","chr9","chr10","chr11","chr12","chr13","chr14","chr15","chr16","chr17","chr18","chr19","chr20","chr22","chrX"))  
 {  
 read.table(file="all.mean",header=F)->M  
 read.table(file="centromeres.hg38.genome",header=F)->C  
 interleave <- function(v1,v2)  
 {  
 ord1 <- 2*(1:length(v1))-1  
 ord2 <- 2*(1:length(v2))  
 c(v1,v2)[order(c(ord1,ord2))]  
 }  
 jpeg(paste(chr,"_OM.jpeg",sep=""))  
 plot(M$V2[M$V1==chr],M$V4[M$V1==chr],xlab="Position along chromosome",ylab="Mean fragment length in Optical Map",main=chr,col="blue",pch=16)  
 lines(interleave(C$V2[C$V1==chr],C$V3[C$V1==chr]),rep(0.2,length(interleave(C$V2[C$V1==chr],C$V3[C$V1==chr]))),col="red",lwd=5)  
 dev.off()  
 }  
Based on below figures, it can be hypothesized that on chr1, chr2, chr3(to certain extent), chr7, chr9, chr11(to certain extent),chr12,chr13, chr14,chr15 and chr20 the mean optical fragment size goes up near centromeres.


Based on the above analysis can one conclude that it is possible to map Centromeres using Optical mapping data? Far from it, the many false positives and lack of signal in many cases are worrying. The following questions are of importance:
 
  1. How does the quality of the genome assembly in the regions adjoining the centromere affect the ability to map centromeres?
  2. How does the enzyme used and repeat content and base composition of the centromere affect the precision of attempts aimed at mapping the centromere?