Using Optical Maps to scaffold genomes of bacteria seems to be a fairly common practice. While it is yet to find widespread use in Eukaryotic species, it has found some success in species such as the cow, rice and parrot.
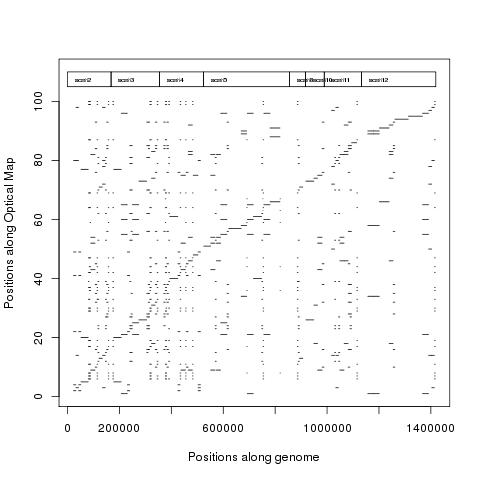
Here we use the assembled Optical map provided as an example with the SOMA package to demonstrate Optical map dot plot creation.
Here we use the assembled Optical map provided as an example with the SOMA package to demonstrate Optical map dot plot creation.
First, we perform an all vs all search between the optical map and in-silico digest of the genome using below script. The script has the parameter called search radius which decides how much flexibility is to be allowed while searching.
 #!/usr/bin/perl
 use warnings;
 use Math::Round qw(nearest);
 use Set::IntSpan;
 #
 #perl Map_Optical.pl scaffold.silico soma_format_maps/1.map
 ## Input parameters
 %cutlens=();
 my $roundoffto=10;
 my $searchradius=200;
 open CUTSITES, $ARGV[0] or die $!;
 while($line = <CUTSITES>){
 chomp $line;
 my @header = split / /, $line;
 my $scaffold=$header[0];
 my $scaflen=$header[1];
 my $totalcutsites= $header[2];
 $line = <CUTSITES>;chomp $line;
 my @cutsites = split / /, $line;
 my $iso="";
 my $cutcount=0;
 my $previous=0;
   foreach $iso (@cutsites){
    my $cutlength=$iso-$previous;
    if($previous>0){
    $cutcount++;
    $key=$scaffold . "#" . $cutcount;
    $cutlens{$cutlength}{$key}=$previous . "_" . $iso;
    }
    $previous=$iso;
    }
          }#end of while loop
 close CUTSITES;
 #print "Done reading Silico-digest provided in file: $ARGV[0]\n";
 my $mapsite=0;
 my %mapmaps=();
 open SOMAP, $ARGV[1] or die $!;
 while($line = <SOMAP>){
 chomp $line;
 my @header2 = split / /, $line;
 $mapsite++;
 my $testvalue=$header2[0];
 my $teststart=$testvalue-$searchradius;
 my $testend=$testvalue+$searchradius;
 #print "Searching for $testvalue lengths with a search radius of $searchradius.\n";
 my $i="";
 for($i=$teststart;$i<$testend;$i++){
    foreach my $key (keys %{$cutlens{$i}}) {
    my @keysp = split /\#/, $key;
      my @beds= split /\_/, $cutlens{$i}{$key};
 # scaffold     start     end     map_position     search_radius_hit     map_frag_len     cut_frag_len
 #   print "$keysp[0]\t$beds[0]\t$mapsite\t$i\t$testvalue\t$keysp[1]\n";
 #   print "$keysp[0]\t$beds[1]\t$mapsite\t$i\t$testvalue\t$keysp[1]\n";
 #   print "$keysp[0]\tNA\tNA\n"
      print "$keysp[0]\t$beds[0]\t$beds[1]\t$mapsite\t$i\t$testvalue\t$keysp[1]\n";
    }
 }
 }#end of while loop
 close SOMAP;
 #!/usr/bin/perl
 use warnings;
 ##
 ##perl getfull.pl genome.fa.fai assembled.map.bed
 ### Input parameters
 #
 my %cumlen=();
 my $cumcount=0;
 open CUTSITES, $ARGV[0] or die $!;
 while($line = <CUTSITES>){
 chomp $line;
 my @header = split /\t/, $line;
 $cumlen{$header[0]}=$cumcount;
 $cumcount=$cumcount+$header[1];
 }
 close CUTSITES;
 open MAPSITES, $ARGV[1] or die $!;
 while($line = <MAPSITES>){
 chomp $line;
 my @header = split /\t/, $line;
 my $start=$header[1]+$cumlen{$header[0]};
 my $end=$header[2]+$cumlen{$header[0]};
 print "Map\t$start\t$header[3]\n";
 print "Map\t$end\t$header[3]\n";
 print "Map\tNA\tNA\n";
 }
 close MAPSITES;
No comments:
Post a Comment