Tuesday, December 16, 2014

More than 10% of structural variants in human genome are in potentially problematic regions

535,461,456 bases which corresponds to 16.22% of the genome are considered "problematic regions in the genome assembly". Looking at the structural variants identified by previous studies available in the UCSC tables, we find 26,934 (13.3 % of reported structural variants) overlap these problematic regions.

                                   Study Overlapping Total         Percent_overlapping_problematic_regions
1        1000 Genomes Consortium Phase 1   2067  20554  10.0564367
2  1000 Genomes Consortium Pilot Project    322   7967   4.0416719
3                         Ahn et al 2009    825   3704  22.2732181
4                       Alkan et al 2009    139    177  78.5310734
5                   Altshuler et al 2010    135    844  15.9952607
6                        Arlt et al 2011    347   2522  13.7589215
7                    Banerjee et al 2011      4    733   0.5457026
8                     Bentley et al 2008    405   5646   7.1732200
9                    Campbell et al 2011    281   1180  23.8135593
10                     Conrad et al 2006     89    672  13.2440476
11                     Conrad et al 2009   1144   8489  13.4762634
12                     Cooper et al 2008    135    311  43.4083601
13                   de Smith et al 2007    303   1492  20.3083110
14                       Feuk et al 2005      0      3   0.0000000
15                   Forsberg et al 2012      0      2   0.0000000
16                     Giglio et al 2002      0      1   0.0000000
17                      Gusev et al 2009     15    211   7.1090047
18                      Hinds et al 2006      2     87   2.2988506
19                    Iafrate et al 2004     56    187  29.9465241
20                     Itsara et al 2009    495   4806  10.2996255
21                  Jakobsson et al 2008    165   1424  11.5870787
22                         Ju et al 2010    321   1289  24.9030256
23                       Kidd et al 2008    934   7380  12.6558266
24                       Kidd et al 2010      1     20   5.0000000
25                      Kidd et al 2010b    179    739  24.2219215
26                        Kim et al 2009    126   1300   9.6923077
27                     Korbel et al 2007    411    974  42.1971253
28                       Levy et al 2007    839  10146   8.2692687
29                      Locke et al 2006    233    353  66.0056657
30                  McCarroll et al 2006    100    531  18.8323917
31                  McCarroll et al 2008    282   1313  21.4775324
32                   McKernan et al 2009    581   6925   8.3898917
33                      Mills et al 2006    332   5321   6.2394287
34                       Pang et al 2010    652   6096  10.6955381
35                       Park et al 2010    844   5747  14.6859231
36                      Perry et al 2008    991   2889  34.3025268
37                     Perry et al 2008b    175    341  51.3196481
38                      Pinto et al 2007    304   1029  29.5432459
39                      Redon et al 2006   1372   3308  41.4752116
40                   Schuster et al 2010     90    186  48.3870968
41                      Sebat et al 2004     36     77  46.7532468
42                     Shaikh et al 2009   1133  12844   8.8212395
43                      Sharp et al 2005     81    105  77.1428571
44              Simon-Sanchez et al 2007     64    232  27.5862069
45                 Stefansson et al 2005      0      1   0.0000000
46                     Teague et al 2010    732   4144  17.6640927
47                      Tuzun et al 2005    132    286  46.1538462
48                       Wang et al 2007    213   1291  16.4988381
49                       Wang et al 2008    235   2644   8.8880484
50                    Wheeler et al 2008     17     23  73.9130435
51                       Wong et al 2007    643   5011  12.8317701
52                      Wong et al 2012b   3347  33069  10.1212616
53                         Xu et al 2011   4599  25794  17.8297278
54                      Young et al 2008      3      7  42.8571429
55                        Zhu et al 2011      3      3 100.0000000

Should these structural variants be removed from the UCSC table? Or atleast do they require further validation.

Friday, December 12, 2014

Sequence divergence between human and chimp

Using the data about ancestral state from UCSC we calculate the fraction of sites that are different between Human and Chimp. We can see in below table that on average 14% of the sites are different between human and chimp. ChrX shows a much higher divergence at 23%, which is expected given its lower Ne.

Chromosome Number of sites that are different Total number of sites Percent difference
chr1 574730 4097311 14.03
chr2 571968 4337056 13.19
chr3 460826 3601819 12.79
chr4 483915 3522581 13.74
chr5 432399 3222413 13.42
chr6 430879 3147588 13.69
chr7 426619 2928175 14.57
chr8 380886 2786423 13.67
chr9 333171 2283198 14.59
chr10 351451 2471725 14.22
chr11 354062 2492733 14.20
chr12 326365 2396839 13.62
chr13 234420 1761333 13.31
chr14 228533 1645955 13.88
chr15 207061 1516600 13.65
chr16 244166 1680348 14.53
chr17 215074 1476349 14.57
chr18 190200 1397643 13.61
chr19 207813 1157902 17.95
chr20 164209 1207849 13.60
chr21 106186 719102 14.77
chr22 113969 721194 15.80
chrX 439833 1906519 23.07


14.54

When we look divergence in windows across chromsome 2 and chromosome X we see higher divergence at the centromere and telomere. (see figures below and note the difference in scale of y-axis).


The fraction of sites that are different between human and chimp in a window is correlated with the DAF's we looked at earlier.  The correlation coefficient for chr2 is 0.4 and for chrX it is 0.2. 

Thursday, December 4, 2014

openSNP MDS plot from plink

After downloading all the genotype data from the openSNP website, the first thing to do is to see population structure ofcourse!

Using AIM's (Ancestry Informative Markers) is a rather quick method to determine ancestry using a minimal set of markers. Various groups have used slightly different methods to come up with such markers. Instead of looking at these markers, we look at Lactose tolerance phenotype and the population structure in the genotypes with this trait.


The MDS plot (generated using plink after converting using opengwas) has one weird outlier that does not cluster. It is curious, but i hope they make the data available in a easier to use/standardised format so that i can dig into this.

The number of males that decided to reveal their gender [290/1379(21.03%) ] is double that of females [149/1379(10.8%) ]. Data of birth was shared slightly more reluctantly with 403/1379 (29.22%) sharing their DOB compared to the 439/1379(31.83%) that shared their gender. Not surprisingly most people who shared their gender also shared their DOB (116/149 females and 253/290 males). See below barplot of the distribution of DOB's with mean age of ~40 (minimum is 19 and max is 114). 


Monday, December 1, 2014

Human chr15 SLC24A5 pigmentation gene

Coming back to being human, we look at chr15 DAF's. The most prominent feature is the short_arm (information not available). Having come across the database of recent positive selection across human populations (dbPSHP), i was hoping to see a clear signal of DAF near the SLC24A5 gene. It does not seem to be one of the more prominent DAF peaks. Infact, adding the SV2B gene onto the plot does not bring it near any of the prominent DAF peaks. Will have to see how many of my DAF peaks actually match up those in the dbPSHP.

The correlation coefficient of 0.3277578 between the mean derived allele frequency and Number of CNV's is line with the results from other chromosomes.

The code is not different from before:

 chr <- "chr15";    
 jpeg(paste("DAF.",chr,".jpeg",sep=""),width=1420)    
 par(mfrow=c(2,1))    
 read.table(file=paste("h.",chr,".mean.bed",sep=""),header=F,stringsAsFactors=F)->M    
 plot(as.numeric(M$V2),as.numeric(M$V4),xlab="Position along chromosome",ylab="Mean derived allele Frequency",main=chr)    
 lines(c(10000,17000000),c(0.2,0.2),col="red",lwd=5)    
 text(10000, 0.25,labels="short_arm",col="red")    
 lines(c(101981189,101991189),c(0.3,0.3),col="blue",lwd=5)    
 text(101981189, 0.35,labels="Telomere",col="blue")    
 lines(c(0,10000),c(0.3,0.3),col="blue",lwd=5)    
 text(0, 0.35,labels="Telomere",col="blue")    
 lines(c(48413169,48434589),c(0.25,0.25),col="brown",lwd=5)    
 text(48413169, 0.3,labels="SLC24A5 gene",col="brown")    
 lines(c(91643182,91844539),c(0.25,0.25),col="brown",lwd=5)    
 text(91643182, 0.3,labels="SV2B gene",col="brown")    
 read.table(file=paste("h.",chr,".countdgv.bed",sep=""),header=FALSE)->C    
 plot(C$V2,C$V4,xlab="Position along chromosome",ylab="Count of known structural variants",main=chr)    
 cor.test(as.numeric(M$V4),C$V4,method="spearman")    
 dev.off()  

Tuesday, November 25, 2014

Allele frequncies of mutations nearer to genes take time to increase in freequency

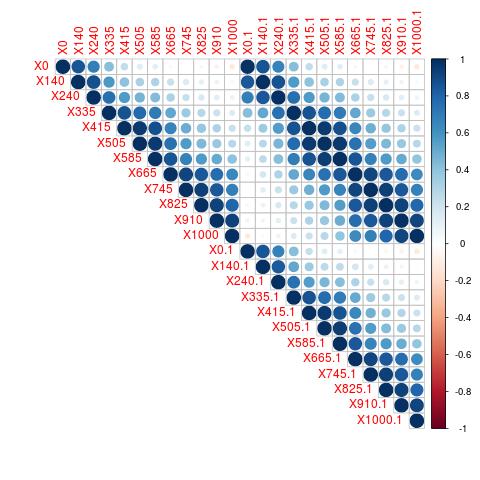
Whole genome sequencing of time course evolving populations is now possible. In their experiment, they monitor the allele frequency of all alleles that reach a frequency greater than 0.1. The fact that the allele frequencies are correlated between time points in both methods used to measure allele frequencies suggests that their method is rather robust. (see correlation plot of allele frequencies at different time points[in minutes]).


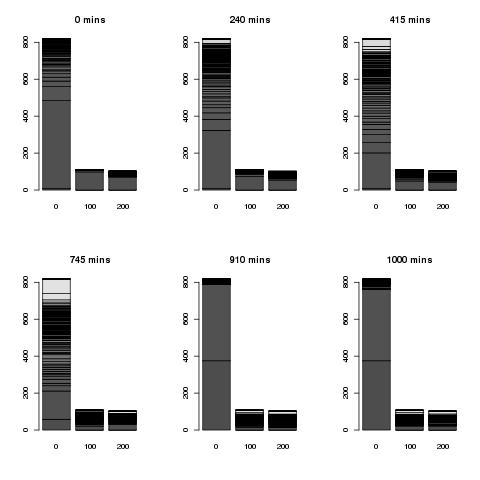
We next explore the change in allele frequency as function of time and distance from the nearest gene. The below plot shows that the allele frequency increases near to genes only in the later stages of the experiment. The first bar represents all the sites nearest to the genes and the bars next to it are those further away from it. Over the time course, the allele frequency of the mutants increase nearer to the gene.


Thursday, November 20, 2014

Novel avian leptin gene is present across the bird phylogeny

Due to the importance of the leptin gene in endocrinology, its existence and behavior in birds have been the focus of considerable debate. The possible inclusion of human contaminant sequences into early bird genome assemblies seems to have been a major complicating factor in understanding Leptin genes in birds. Only recently, with the availability of the Pigeon genome with a well annotated leptin gene has it become evident that birds have a novel gene that has sequence similarity to the mammalian leptin. However, debate regarding its function, tissue specificity and expression patterns are yet to be resolved conclusively. 

With the availability of numerous bird genome assemblies, courtesy of the NGS revolution in sequencing it is now possible to visualize and may be even quantify the prevalence of the leptin gene across different bird groups. Without debating the naming of the leptin like gene annotated in the Pigeon, we take it as given for all our analysis. A simple blastX search provides numerous significant hits. 

Two of the significant hits are from birds, specifically Taeniopygia guttata leptin-like protein precursor and Melopsittacus undulatus leptin precursor. We also get many hits from reptiles before moving to mammals.

Tuesday, November 18, 2014

Optical map dot plot

Using Optical Maps to scaffold genomes of bacteria seems to be a fairly common practice. While it is yet to find widespread use in Eukaryotic species, it has found some success in species such as the cow, rice and parrot.

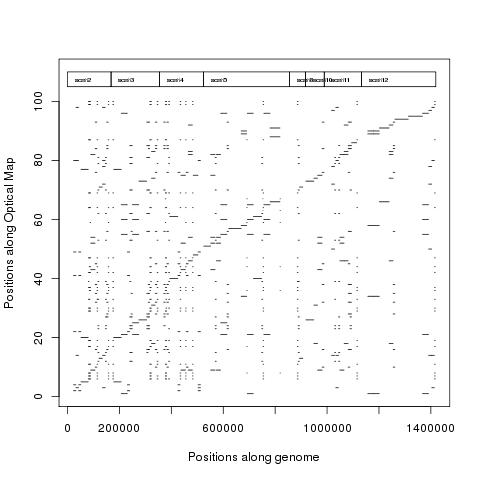
Here we use the assembled Optical map provided as an example with the SOMA package to demonstrate Optical map dot plot creation.

First, we perform an all vs all search between the optical map and in-silico digest of the genome using below script. The script has the parameter called search radius which decides how much flexibility is to be allowed while searching.
 #!/usr/bin/perl   
 use warnings;   
 use Math::Round qw(nearest);  
 use Set::IntSpan;  
 #  
 #perl Map_Optical.pl scaffold.silico soma_format_maps/1.map  
 ## Input parameters  
 %cutlens=();  
 my $roundoffto=10;  
 my $searchradius=200;  
 open CUTSITES, $ARGV[0] or die $!;  
 while($line = <CUTSITES>){  
 chomp $line;  
 my @header = split / /, $line;  
 my $scaffold=$header[0];  
 my $scaflen=$header[1];  
 my $totalcutsites= $header[2];  
 $line = <CUTSITES>;chomp $line;  
 my @cutsites = split / /, $line;  
 my $iso="";  
 my $cutcount=0;  
 my $previous=0;  
   foreach $iso (@cutsites){  
    my $cutlength=$iso-$previous;  
    if($previous>0){  
    $cutcount++;  
    $key=$scaffold . "#" . $cutcount;  
    $cutlens{$cutlength}{$key}=$previous . "_" . $iso;  
    }  
    $previous=$iso;  
    }  
          }#end of while loop  
 close CUTSITES;  
 #print "Done reading Silico-digest provided in file: $ARGV[0]\n";  
 my $mapsite=0;  
 my %mapmaps=();  
 open SOMAP, $ARGV[1] or die $!;   
 while($line = <SOMAP>){   
 chomp $line;  
 my @header2 = split / /, $line;  
 $mapsite++;  
 my $testvalue=$header2[0];  
 my $teststart=$testvalue-$searchradius;  
 my $testend=$testvalue+$searchradius;  
 #print "Searching for $testvalue lengths with a search radius of $searchradius.\n";  
 my $i="";  
 for($i=$teststart;$i<$testend;$i++){  
    foreach my $key (keys %{$cutlens{$i}}) {  
    my @keysp = split /\#/, $key;  
      my @beds= split /\_/, $cutlens{$i}{$key};  
 # scaffold     start     end     map_position     search_radius_hit     map_frag_len     cut_frag_len  
 #   print "$keysp[0]\t$beds[0]\t$mapsite\t$i\t$testvalue\t$keysp[1]\n";  
 #   print "$keysp[0]\t$beds[1]\t$mapsite\t$i\t$testvalue\t$keysp[1]\n";  
 #   print "$keysp[0]\tNA\tNA\n"  
      print "$keysp[0]\t$beds[0]\t$beds[1]\t$mapsite\t$i\t$testvalue\t$keysp[1]\n";  
    }  
 }  
 }#end of while loop  
 close SOMAP;  
After performing a search of the Optical map, the output bed file can be converted into a dotplot file using below script:
 #!/usr/bin/perl  
 use warnings;  
 ##  
 ##perl getfull.pl genome.fa.fai assembled.map.bed   
 ### Input parameters  
 #  
 my %cumlen=();  
 my $cumcount=0;  
 open CUTSITES, $ARGV[0] or die $!;  
 while($line = <CUTSITES>){  
 chomp $line;  
 my @header = split /\t/, $line;  
 $cumlen{$header[0]}=$cumcount;  
 $cumcount=$cumcount+$header[1];  
 }  
 close CUTSITES;  
 open MAPSITES, $ARGV[1] or die $!;  
 while($line = <MAPSITES>){  
 chomp $line;  
 my @header = split /\t/, $line;  
 my $start=$header[1]+$cumlen{$header[0]};  
 my $end=$header[2]+$cumlen{$header[0]};  
 print "Map\t$start\t$header[3]\n";  
 print "Map\t$end\t$header[3]\n";  
 print "Map\tNA\tNA\n";  
 }  
 close MAPSITES;  
The figure below shows the dotplot of the Optical map created using above scripts with a search radius of 200 base pairs. Increasing the search radius saturates the plot while allowing for more distant hits.

Thursday, November 13, 2014

Human chr6 also has the MHC region which shows a DAF peak

Human chr6 has another prominent peak of DAF, corresponding to the MHC region. Flanked by the genes MOG and COL11A2, it spans from approximately 29624758 to 33145670 in the hg19 assembly. Below figure shows the MHC region in blue with the flanking genes in brown. The number of CNV's also jumps up in this region. 


 chr <- "chr6";    
 jpeg(paste("DAF.",chr,".jpeg",sep=""),width=1420)    
 par(mfrow=c(2,1))    
 read.table(file=paste("h.",chr,".mean.bed",sep=""),header=F,stringsAsFactors=F)->M    
 plot(as.numeric(M$V2),as.numeric(M$V4),xlab="Position along chromosome",ylab="Mean derived allele Frequency",main=chr)    
 lines(c(58830166,61830166),c(0.2,0.2),col="red",lwd=5)    
 text(63830166, 0.25,labels="Centromere",col="red")    
 lines(c(171105067,171115067),c(0.3,0.3),col="blue",lwd=5)    
 text(171105067, 0.35,labels="Telomere",col="blue")    
 lines(c(0,10000),c(0.3,0.3),col="blue",lwd=5)    
 text(0, 0.35,labels="Telomere",col="blue")    
 lines(c(57182422,57513376),c(0.25,0.25),col="brown",lwd=5)    
 text(57182422, 0.3,labels="PRIM2 gene",col="brown")    
 M[M$V2>57182422 & M$V3<57513376,]->N   
 points(N$V2,N$V4,pch=13,col="blue")   
 lines(c(33130469,33145670),c(0.35,0.35),col="brown",lwd=5)    
 text(39945670, 0.35,labels="COL11A2 gene",col="brown")    
 lines(c(29624758,29638656),c(0.35,0.35),col="brown",lwd=5)    
 text(25000000, 0.35,labels="MOG gene",col="brown")    
 lines(c(29624758,33145670),c(0.38,0.38),col="blue",lwd=5)    
 text(29624758, 0.42,labels="MHC",col="blue")    
 read.table(file=paste("h.",chr,".countdgv.bed",sep=""),header=FALSE)->C    
 plot(C$V2,C$V4,xlab="Position along chromosome",ylab="Count of known structural variants",main=chr)    
 cor.test(as.numeric(M$V4),C$V4,method="spearman")    
 dev.off()  

Wednesday, November 12, 2014

Human chr6 DAF peak contains PRIM2 gene

Continuing the discussion on DAF's, we look at chr6 and specifically the PRIM2 gene region thought to be under balancing selection.
 chr <- "chr6";   
 jpeg(paste("DAF.",chr,".jpeg",sep=""),width=1420)   
 par(mfrow=c(2,1))   
 read.table(file=paste("h.",chr,".mean.bed",sep=""),header=F,stringsAsFactors=F)->M   
 plot(as.numeric(M$V2),as.numeric(M$V4),xlab="Position along chromosome",ylab="Mean derived allele Frequency",main=chr)   
 lines(c(58830166,61830166),c(0.2,0.2),col="red",lwd=5)   
 text(63830166, 0.25,labels="Centromere",col="red")   
 lines(c(171105067,171115067),c(0.3,0.3),col="blue",lwd=5)   
 text(171105067, 0.35,labels="Telomere",col="blue")   
 lines(c(0,10000),c(0.3,0.3),col="blue",lwd=5)   
 text(0, 0.35,labels="Telomere",col="blue")   
 lines(c(57182422,57513376),c(0.25,0.25),col="brown",lwd=5)   
 text(57182422, 0.3,labels="PRIM2 gene",col="brown")   
 M[M$V2>57182422 & M$V3<57513376,]->N  
 points(N$V2,N$V4,pch=13,col="blue")  
 read.table(file=paste("h.",chr,".countdgv.bed",sep=""),header=FALSE)->C   
 plot(C$V2,C$V4,xlab="Position along chromosome",ylab="Count of known structural variants",main=chr)   
 cor.test(as.numeric(M$V4),C$V4,method="spearman")   
 dev.off()  
The correlation coefficient of 0.2559672 between the mean derived allele frequency and Number of CNV's is line with the results from chr2. The PRIM2 gene that has been shown to have high values of diversity and Tajima's D is located near the centromere and has high mean DAF values. The windows within the PRIM2 gene are marked by blue crosses. 


Monday, November 10, 2014

Human DAF - Derived Allele Frequency plots

A map of recent positive selection in Human genome calculated DAF's apart from various other selection scan statistics. Here we calculate mean DAF's in 50Kb windows for each chromosome and see how it  correlates with CNV density.

Each step and the commands used are documented here:

Use mysql to directly query the UCSC genome browser tables to download the ancestral state of Human SNP's in Chimp, Orangutan and Macaque along with the allele frequencies.

 for i in chr2 chr3 chr4 chr5 chr6 chr7 chr8 chr9 chr10 chr11 chr12 chr13 chr14 chr15 chr16 chr17 chr18 chr19 chr20 chr22 chrX  
 do  
 echo "SELECT t2.chrom,t2.chromStart,t2.chromEnd,t2.name,t2.humanObserved,t2.humanAllele,t2.chimpAllele,t2.orangAllele,t2.macaqueAllele,t1.alleles,t1.alleleFreqs FROM hg19.snp141 AS t1, hg19.snp141OrthoPt4Pa2Rm3 AS t2 WHERE t1.name = t2.name AND t2.chrom='$i'"|mysql --user=genome --host=genome-mysql.cse.ucsc.edu -B -A > human."$i".csv  
 done  

Next, we decide on the ancestral state of each site using parsimony. Sites in which Chimp, Orangutan and Macaque agree are easy to resolve. Similarly, when either the first two (Chimp and Orangutan) or the last two (Orangutan and Macaque) agree, the ancestral state can be decided. In all other cases, we discard the site altogether. Other methods that use Maximum likelihood to infer ancestral state have also been used.
 #!/usr/bin/perl  
 ## Input parameters  
 my $ancfreq = $ARGV[0];  
 open(FILE1, $ancfreq);  
 $header=<FILE1>;#read header  
 while($header=<FILE1>) {  
      $header=~s/\,/\t/g;  
      my @parts=split(/\t/,$header);  
 my $chrom=$parts[0];  
 my $start=$parts[1];  
 my $end=$parts[2];  
 my $chimpA=$parts[6];  
 my $OrgangA=$parts[7];  
 my $MacA=$parts[8];  
 my $anctype= $chimpA. $OrgangA. $MacA;$anctype=~s/(.)(?=.*?\1)//g;  
  if((length $anctype)==1){$found3++;}  
         else{  
             $anctype= $chimpA. $OrgangA;$anctype=~s/(.)(?=.*?\1)//g;  
             if((length $anctype)==1){$foundfirst2++;}  
                 else{  
                 $anctype= $OrgangA. $MacA;$anctype=~s/(.)(?=.*?\1)//g;  
                 if((length $anctype)==1){$foundlast2++;}  
                 elsif((length $anctype)>2){$trial++;$anctype="N";}  
                 else{$anctype="N";$notfound++;}  
                 }  
         }#end of else  
 my $a1=$parts[9];  
 my $a2=$parts[10];  
 my $a1freq=$parts[12];  
 my $a2freq=$parts[13];  
 my $derivedfreq=0;  
 if($anctype=~m/$a2/){$derivedfreq=$a1freq;}  
 elsif($anctype=~m/$a1/){$derivedfreq=$a2freq;}  
 if($derivedfreq>0){print "$chrom\t$start\t$end\t$derivedfreq\t$chimpA\t$OrgangA\t$MacA\t$anctype\n";}  
      }  
 close FILE1;  
 #hg38.snp141OrthoPt4Pa2Rm3.chrom    hg38.snp141OrthoPt4Pa2Rm3.chromStart  hg38.snp141OrthoPt4Pa2Rm3.chromEnd   hg38.snp141OrthoPt4Pa2Rm3.name hg38.snp141OrthoPt4Pa2Rm3.humanObserved hg38.snp141OrthoPt4Pa2Rm3.humanAllele hg38.snp141OrthoPt4Pa2Rm3.chimpAllele  hg38.snp141OrthoPt4Pa2Rm3.orangAllele  hg38.snp141OrthoPt4Pa2Rm3.macaqueAllele hg38.snp141.alleles   hg38.snp141.alleleFreqs  

After deciding on the ancestral state, the derived allele frequency is printed for each of the sites that is retained. The mean DAF can then be easily calculated using the map command in bedtools.

 for i in chr1 chr2 chr3 chr4 chr5 chr6 chr7 chr8 chr9 chr10 chr11 chr12 chr13 chr14 chr15 chr16 chr17 chr18 chr19 chr20 chr21 chr22 chrX  
 do  
 bedtools makewindows -g Homo_sapiens.GRCh37.57.dna.concat.fa.fai -w 50000|awk -v c="$i" '$1==c{print $0}' > "$i".50k.bed  
 perl Afreqbed.pl human."$i".csv > h."$i".bed  
 bedtools map -a "$i".50k.bed -b h."$i".bed -c 4 -o mean > h."$i".mean.bed  
 done  

The mysql interface to UCSC genome browser makes it easy to download all know structural variants from numerous publications.

 mysql --user=genome --host=genome-mysql.cse.ucsc.edu -B -A -e "SELECT * FROM hg19.dgvMerged;" > human_dgvMerged.csv    
Just retaining the co-ordinates (along with length) of the CNV's we create a bed file with below command:

 grep -v "^bin" human_dgvMerged.csv|awk '{print $2,$3,$4,($4-$3)}'|sed 's/ /\t/g' >dgv.bed  

Now that we have everything in the bed format, use the "map" command from bedtools to calculate count of CNV's and plot it for chromosome 2.


 for i in chr1 chr2 chr3 chr4 chr5 chr6 chr7 chr8 chr9 chr10 chr11 chr12 chr13 chr14 chr15 chr16 chr17 chr18 chr19 chr20 chr21 chr22 chrX  
 do  
 bedtools map -a "$i".50k.bed -b dgv.bed -c 3,4 -o count,sum > h."$i".countdgv.bed  
 done  

 chr <- "chr2";  
 jpeg(paste("DAF.",chr,".jpeg",sep=""),width=1420)  
 par(mfrow=c(2,1))  
 read.table(file=paste("h.",chr,".mean.bed",sep=""),header=F,stringsAsFactors=F)->M  
 plot(as.numeric(M$V2),as.numeric(M$V4),xlab="Position along chromosome",ylab="Mean derived allele Frequency",main=chr)  
 lines(c(92326171,95326171),c(0.6,0.6),col="red",lwd=5)  
 text(92326171, 0.65,labels="Centromere",col="red")  
 lines(c(243189373,243199373),c(0.5,0.5),col="blue",lwd=5)  
 text(243189373, 0.55,labels="Telomere",col="blue")  
 lines(c(0,10000),c(0.5,0.5),col="blue",lwd=5)  
 text(0, 0.55,labels="Telomere",col="blue")  
 lines(c(90545103,91545103),c(0.7,0.7),col="green",lwd=5)  
 text(90545103, 0.75,labels="heterochromatin",col="green")  
 lines(c(136545415,136594750),c(0.6,0.6),col="brown",lwd=5)  
 text(136545415, 0.65,labels="LCT gene",col="brown")  
 read.table(file=paste("h.",chr,".countdgv.bed",sep=""),header=FALSE)->C  
 plot(C$V2,C$V4,xlab="Position along chromosome",ylab="Count of known structural variants",main=chr)  
 cor.test(as.numeric(M$V4),C$V4,method="spearman")  
 dev.off()  

We see a positive correlation between mean derived allele frequency and number of known CNV's per 50Kb window with a rho of 0.2496694.

Monday, November 3, 2014

Liftover - what gets lost in translation?

Many genomic analysis require the conversion of genomic coordinates of one genome into another. When a new version of the genome assembly is created, all the data (such as annotation, recombination map, variant calls, genomic features) associated with the older version of the genome need to be "lifted" over to the new genome. 

Similarly, when performing comparative genomic analysis, the homologous regions of genomes need to be identified between genomes that are sometime rather distant. The initial draft annotations of genomes use the lifted over annotations from high quality genomes as the primary raw material. This is an extremely important source of information when RNAseq data is not available. 

Given the increasing importance of such lifting over of genomic coordinates, new tools that can perform this rather simple sounding task are increasing in number. Apart from the established liftOver utility from UCSC, CrossMap, Kraken, NCBI genome remapping service also provide well established pipelines for converting the genomic coordinates for files in different formats such as bed, gff, SAM(& BAM), VCF, Wiggle, BigWig, etc. The UCSC liftOver tool has been implemented in the GALAXY suite, used in VTools, pyliftOver and rtracklayer (a Bioconductor package). All implementations of the UCSC liftover tool as well as CrossMap use the chain files that require many steps to create. If you are lucky enough to be working on one of the genome supported by UCSC, you can download the ready to use chain files directly from the UCSC website.

The original paper that introduced the liftOver utility has some useful technical information about how the the process works and also performance in different regions of the genome. Kraken, uses a different method that does not require all vs all alignments to perform the lifting over of coordinates. One the key features of the liftOver utility is its ability to "handle large gaps" in alignment. Due to its robustness and ease of use, the liftOver utility has been used in numerous studies in very different studies. 

In a series of blog posts, we will analyze and quantify the performance of the UCSC liftOver utility.


Friday, October 31, 2014

Single nucleotide polymorphisms that are associated with traits based on genome wide studies in human populations are under-represented in known repeat regions

Thanks to tips for dealing with the GWAS catalog, it would be easy to see how many of the GWAS SNP's are in repeats. However, the GWAS catalog has its very own quirks such as naming "chrX" as "23". Hence, downloading a bed file of the GWAS catalog from the UCSC genome browser makes things much simpler.

Running below commands shows 21,824 GWAS SNP's of which 16,763 are unique. All coordinates are in GRCh38/hg38. The "rmsk" table was downloaded from the UCSC genome browser with 5,520,017 records spanning 1,588,381,100 base pairs. This table comes with annotation for repeats with details such as repeat name, repeat class and repeat family. The table had 15,474 unique repeat names.

 cut -f 1-2 UCSC_GWAS.bed |grep -v "^#"|wc -l  
 cut -f 1-2 UCSC_GWAS.bed |grep -v "^#"|sort -u|wc -l  
sort -k1,1 -k2,2n UCSC_GWAS.bed > sorted.UCSC_GWAS.bed
sort -k1,1 -k2,2n UCSC_rmsk.bed > sorted.UCSC_GWAS.bed

Both of the UCSC table based bed files are sorted for ease of use. Out of the 21,824 GWAS SNPs 6,618 (5222 unique) overlapped annotated repeats.

 intersectBed -a sorted.UCSC_GWAS.bed -b sorted.UCSC_rmsk.bed -wa -wb|cut -f 1,2,3,23,24,25,28,29,30 > repeats.gwas.hits  

One can perform a fishers exact test (implemented in bedtools) to check if this overlap/non-overlap is significant, given a particular genome size. One would expect that SNP's associated with traits are less likely to be in repeat regions than expected by chance.

 wget ftp://ftp.ncbi.nlm.nih.gov/genbank/genomes/Eukaryotes/vertebrates_mammals/Homo_sapiens/GRCh38/seqs_for_alignment_pipelines/GCA_000001405.15_GRCh38_full_analysis_set.fna.gz  
 gunzip GCA_000001405.15_GRCh38_full_analysis_set.fna.gz  
 samtools faidx GCA_000001405.15_GRCh38_full_analysis_set.fna  
 cut -f 1-2 GCA_000001405.15_GRCh38_full_analysis_set.fna.fai|sort -k1,1 -k2,2n > genome.file  
 bedtools fisher -a sorted.UCSC_GWAS.bed -b sorted.UCSC_rmsk.bed -g genome.file  

The left tail of the test is significant. This is in line with our expectation that the probability of a site located in a repeat to be not associated with a trait is higher than a site not located in a repeat region.

 # Contingency Table  
 #_________________________________________  
 #      | not in -b  | in -b    |  
 # not in -a | 1623119853  | 11545    |  
 #   in -a | 1586321308  | 5222     |  
 #_________________________________________  
 # p-values for fisher's exact test  
 left  right  two-tail    ratio  
 0.00000 1.00000 0.00000 0.463  

Apart from the fisher's test, bedtools has a utility called "jaccard" that provides a single statistic measuring the similarity of the two sets. This statistic ranges from 0 to 1, with 1 being complete identity between the two sets. In the comparison of repeats and GWAS SNP's the score is very small, showing that the sets are not similar.

 bedtools jaccard -a sorted.UCSC_GWAS.bed -b sorted.UCSC_rmsk.bed   
 intersection     union-intersection     jaccard     n_intersections  
 5222     1586338075     3.29186e-06     5221  

Comparing the prevalence of GWAS SNP's  in repeats with different levels of divergence from the repeat consensus sequence can tell us some useful things. For example, one would expect the GWAS SNP's to be in regions with higher divergence from the consensus sequence, both due to the ability of these regions to have acquired a function as well as our ability to detect associations in these regions.  However, it might be harder to assemble and annotate the younger repeat classes compared to older more diverged repeats. Hence, a comparison of the repeat classes might not be ideal.

 intersectBed -b sorted.UCSC_GWAS.bed -a repeat.div.bed -wa > repeat.div.intersect  

We created a bed file with the sequence divergence from the repeat consensus using the data available on the repeatmasker website. This was intersected with the GWAS SNP's. We calculated the lengths of the genome that each level of sequence divergence occupies. We then compared the number of GWAS SNP's located in each of these levels as a fraction.

 read.table(file="repeat.div.bed",header=FALSE)->M  
 abs(M$V3-M$V2)->M$V5  
 round(M$V4)->M$V6  
 aggregate(M$V5,by=list(M$V6),sum)->C  
 read.table(file="repeat.div.intersect",header=FALSE)->N  
 abs(N$V3-N$V2)->N$V5  
 round(N$V4)->N$V6  
 aggregate(N$V5,by=list(N$V6),sum)->R  
 merge(C,R,by="Group.1",all=TRUE)->CR  
 CR$x.y/CR$x.x->CRR  
 barplot(t(data.matrix(CRR)),beside=TRUE,col=c("darkblue"))  
 quantile(CRR,na.rm=TRUE)  
      0%     25%     50%     75%     100%   
 2.221916e-05 1.114180e-03 2.097250e-03 2.967695e-03 4.996991e-03   

From the above quantiles, it appears that the third and second quantile have most of the GWAS SNP's.

 > shapiro.test(CRR)  
      Shapiro-Wilk normality test  
 data: CRR  
 W = 0.971, p-value = 0.302  

Doing the shapiro test, we are not able to reject the null hypothesis that the data are normally distributed.Based on this, one might say that irrespective of the "age" of the repeat, we are able to detect GWAS SNP's located in them.

The actual number of GWAS SNP's in each of the repeat classes is given below:
       DNA      DNA?      LINE Low_complexity      LTR   
       667       1      3200       13      1428   
      LTR?       RC      rRNA   Satellite     scRNA   
        8       2       1       7       2   
  Simple_repeat      SINE     snRNA    Unknown   
       100      1175       2       12   

Number of GWAS SNP's by repeat family looks like below:

    5S-Deu-L2      Alu     centr      CR1      DNA   
        3      322       5      103       4   
      DNA?    Dong-R4      ERV1     ERV1?      ERVK   
        1       6      417       1       22   
      ERVL   ERVL-MaLR     ERVL?     Gypsy     Gypsy?   
       401      532       6       35       7   
       hAT     hAT-Ac hAT-Blackjack  hAT-Charlie   hAT-Tip100   
        2       2       17      318       67   
   hAT-Tip100?    Helitron       L1       L2 Low_complexity   
        1       2      1976      1066       13   
       LTR      LTR?      MIR    PiggyBac   PiggyBac?   
        7       8      841       1       2   
      rRNA    RTE-BovB     RTE-X   Satellite     scRNA   
        1       15       34       2       2   
  Simple_repeat     snRNA TcMar-Mariner   TcMar-Tc2  TcMar-Tigger   
       100       2       3       4      246   
      tRNA    tRNA-Deu    tRNA-RTE    Unknown   
        3       2       4       12   


Wednesday, October 1, 2014

Drosophila transcriptome reveals interesting patterns in splicing diversity

The Drosophila transcriptome has been analysed in different conditions to understand its diversity. Here, we re-analyse the supplementary materials(only from supplementary table-3) and find "interesting" patterns in splicing diversity.

 read.table(file="supp3",header=T)->S  
 #calculate percentage of genes with more than 1 isoform  
 length(S$transcripts[S$transcripts>1])*100/ length(S$transcripts)  
 #calculate percentage of genes with more than 1 protein  
 length(S$proteins[S$proteins>1])*100/ length(S$proteins)  
 summary(S)  

Over half of the 17,564 annotated genes (10,136; 57%) have more than one transcript isoform. However, only 37% (6,584) of the genes have more than one protein, suggesting that most of the transcript diversity is outside the protein coding regions. While the genes have on average 17.39 transcripts, only 2.59 proteins are found on average per gene. 

This contrast between the number of transcripts and proteins is very pronounced in genes with very large number of transcripts. Infact, the gene "gish" which has 18,972 transcripts has only 142 proteins. See below plot that shows the number of records with the words "exon" and "CDS" from the "gish" gene in the new annotation.


The above figure clearly shows that most "exon" records occur at the beginning and end of the gene. The "CDS" records are restricted to the core of the gene. The same pattern is better captured by the authors of the study using the new metric `per cent spliced in’ (Ψ) index.


Thursday, September 25, 2014

Genome base pair correction tool

High rates of sequencing errors in Next-generation sequencing methods can percolate down into genome assemblies. Presence of incorrect bases in genome assemblies can have an impact on analysis that use the genome assembly for functional analysis.While programs like REAPR are able to correct genome assemblies based on mapped reads, it is focused on identifying large scale structural errors in genome assemblies. 

Draft genome assemblies are being generated for a large number of species using Next-generation sequencing methods. Here we present BCD (Base Correction Don), a tool that conservatively identifies single base-pair level errors in genome assembly sequences based on paired-end reads mapped to the genome.

 #!/usr/bin/perl  
 #use strict;  
 use warnings;  
 use List::Util qw(min max);  
 #perl fixbases.pl example.fasta example.coverage > example.corrected.fasta  
 # Input parameters  
 my $genome = $ARGV[0];  
 my $coverage = $ARGV[1];  
 my $totalcount=0;  
 my $minreadcoverage=20;# minimum number of reads required at site to consider it  
 my $maxreadcoverage=200;  
 my $maxindelcount=5;  
 open FASTA1, $genome or die $!;  
 open LOGS, ">test.bed" or die $!;  
 my $seqst_temp="";  
 my %seqs = ();  
 while($line = <FASTA1>){  
     if($line=~ /^>/){  
      if($header){$seqs{$header}=$seqst_temp;}  
      chomp $line;$header="";$header=$line;$seqst_temp="";  
     }  
     else{$line =~ s/[\n\t\f\r_0-9\s]//g;$seqst_temp .= $line;}  
  }#end of while loop  
     if($header){$seqs{$header}=$seqst_temp;}  
 close FASTA1;  
 open FASTA2, $coverage or die $!;  
 while($line = <FASTA2>){  
 chomp $line;$line=$line . "\t}";  
 my @jelly=split(/\s+/,$line);  
 splice @jelly, 4, 0, 'SnowWhite', 'Humbert';  
 my $scaf=$jelly[0];  
 my $pos=$jelly[1];  
 my $oldbase=$jelly[2];  
 my $totalreads=$jelly[3];  
 my @jellyA=split(/\:/,$jelly[7]);#A  
 my @jellyC=split(/\:/,$jelly[8]);#C  
 my @jellyG=split(/\:/,$jelly[9]);#G  
 my @jellyT=split(/\:/,$jelly[10]);#T  
 my @jellyN=split(/\:/,$jelly[11]);#N  
 my $indelcount=0;  
 if(!($jelly[12]=~ /\}/)){  
 my @jellyindel=split(/\:/,$jelly[12]);#indel  
 $indelcount=$jellyindel[1];  
 }  
 my @counts;  
 push @counts,$jellyA[1];  
 push @counts,$jellyC[1];  
 push @counts,$jellyG[1];  
 push @counts,$jellyT[1];  
 push @counts,$jellyN[1];  
 push @counts,$indelcount;  
     if(($totalreads>$minreadcoverage)&&($indelcount<$maxindelcount)&&($totalreads<$maxreadcoverage)){$totalcount++;  
 my $maxbase= max @counts;  
 my $maxbasepercent=$maxbase*0.1;  
 my $maxbaseval=$oldbase;  
 if($jellyA[1]==$maxbase){$maxbaseval="A";}  
 elsif($jellyC[1]==$maxbase){$maxbaseval="C";}  
 elsif($jellyG[1]==$maxbase){$maxbaseval="G";}  
 elsif($jellyT[1]==$maxbase){$maxbaseval="T";}  
 elsif($jellyN[1]==$maxbase){$maxbaseval="N";}  
 else{$maxbaseval=$oldbase;}  
 my $maxbaseval2=lc $maxbaseval;  
 if((($oldbase=~ /[Aa]/)&&($jellyA[1]==0))||(($oldbase=~ /[Cc]/)&&($jellyC[1]==0))||(($oldbase=~ /[Gg]/)&&($jellyG[1]==0))||(($oldbase=~ /[Tt]/)&&($jellyT[1]==0))){  
 print LOGS "$scaf\t$pos\t$pos\t$maxbaseval\t$oldbase.\t$jellyA[1]\t$jellyC[1]\t$jellyG[1]\t$jellyT[1]\t$jellyN[1]\tzero\t$totalreads\n";  
 my $key=">" . $scaf;  
 my $prepos=$pos-1;#1 based positions  
 substr($seqs{$key},$prepos,1)= $maxbaseval;  
 }  
 elsif((($oldbase=~ /[Aa]/)&&($jellyA[1]<$maxbasepercent))||(($oldbase=~ /[Cc]/)&&($jellyC[1]<$maxbasepercent))||(($oldbase=~ /[Gg]/)&&($jellyG[1]<$maxbasepercent))||(($oldbase=~ /[Tt]/)&&($jellyT[1]<$maxbasepercent))){  
 print LOGS "$scaf\t$pos\t$pos\t$maxbaseval\t$oldbase.\t$jellyA[1]\t$jellyC[1]\t$jellyG[1]\t$jellyT[1]\t$jellyN[1]\tpercent\t$totalreads\n";  
 my $key=">" . $scaf;  
 my $prepos=$pos-1;#1 based positions  
 substr($seqs{$key},$prepos,1)= $maxbaseval;  
 }  
     }  
  }#end of while loop  
 close FASTA2;  
 my $iso;  
 foreach $iso (sort keys %seqs) {  
 print "$iso\n$seqs{$iso}\n";  
 }  
 #scaffold_0   50   c    45   GENOMEseq    {    =:0:0.00:0.00:0.00:0:0:0.00:0.00:0.00:0:0.00:0.00:0.00 A:0:0.00:0.00:0.00:0:0:0.00:0.00:0.00:0:0.00:0.00:0.00 C:1:29.00:44.00:29.00:0:1:0.06:0.00:0.00:0:0.00:100.00:0.03 G:43:28.49:64.21:27.42:20:23:0.59:0.04:234.35:20:0.62:97.95:0.44    T:1:29.00:68.00:29.00:1:0:0.92:0.16:659.00:1:0.53:98.00:0.53  N:0:0.00:0.00:0.00:0:0:0.00:0.00:0.00:0:0.00:0.00:0.00   }  
 #scaffold_0   1    g    43   =:0:0.00:0.00:0.00:0:0:0.00:0.00:0.00:0:0.00:0.00:0.00 A:0:0.00:0.00:0.00:0:0:0.00:0.00:0.00:0:0.00:0.00:0.00 C:0:0.00:0.00:0.00:0:0:0.00:0.00:0.00:0:0.00:0.00:0.00   G:40:33.40:59.08:31.00:19:21:0.00:0.03:0.00:0:0.00:0.00:0.00  T:2:31.00:33.00:31.00:0:2:0.00:0.05:0.00:0:0.00:0.00:0.00    N:1:60.00:33.00:25.00:1:0:0.00:0.05:0.00:0:0.00:0.00:0.00  
 print LOGS "$totalcount\n";  
 close LOGS;  

All paired end data used for performing the genome assembly were mapped back to the genome assembly using bwa read mapper with default settings. Number of reads supporting each of the four bases at individual positions was tabulated using the program bam-readcount. The above script was then used to correct the genome for single base pair errors.

Friday, August 22, 2014

Extract sequences from multi fasta file in a particular order


 #!/usr/bin/perl  
 use warnings;  
 #perl extractInOrder.pl test.fasta test.list  
 # Input parameters  
 open FASTA, $ARGV[0] or die $!;  
 my $seqst_temp="";  
 my $seqs = ();  
 while($line = <FASTA>){  
 if($line=~ /^>/){  
 if($header){  
 $header=~s/>//;  
 $seqs{$header}=$seqst_temp;  
 }  
 chomp $line;  
 $header="";  
 $header=$line;  
 $seqst_temp="";  
 }  
 else{  
 $line =~ s/[\n\t\f\r_0-9\s]//g;  
 $seqst_temp .= $line;  
 }  
 }#end of while loop  
 if($header){  
 $header=~s/>//;  
 $seqs{$header}=$seqst_temp;  
 }  
 close FASTA;  
 open FASTA, $ARGV[1] or die $!;  
 while($line = <FASTA>){  
 chomp $line;  
 $line=~s/>//;  
 if(exists $seqs{$line}){print ">$line\n$seqs{$line}\n";}  
 else {  
 print "Sequence header $line does not exist in fasta\n";  
 exit();  
 }  
 }  
 close FASTA;  

Merge multiple kmer count hashes into one

A previous attempt at merging two kmer count hashes was neither memory efficient nor capable of merging multiple kmer count hashes. Here, we use the age old trick of sorting to write a more memory efficient script that can handle as N number of hashes.


 cat *_"$kmer"_counts.fa|sort > sorted_"$kmer"_all.fa  

The above command will concatenate all the hashes and sort it. This sorted file can then be used by the below perl script to merge the hashes. Since, all kmers that need to be merged are in adjacent lines, the memory needed for merging is drastically reduced compared to the previous script.


 #!/usr/bin/perl  
 use warnings;  
 # Input parameters  
 open FASTA1, $ARGV[0] or die $!;  
 my $previous="Kmer";  
 my $previousCount="Kmercount"; 
 my @jelly;
  while($line = <FASTA1>){  
 chomp $line;  
 @jelly=split(/\s+/,$line);  
      if($previous=~/$jelly[0]/){  
      $previousCount=$previousCount+$jelly[1];  
      }  
      else{  
      print "$previous\t$previousCount\n";  
      $previous=$jelly[0];$previousCount=$jelly[1];  
      }  
 }  
      #printing last line if it needed merging  
      if($previous=~/$jelly[0]/){  
      print "$previous\t$previousCount\n";  
      }  
 close FASTA1;  

Tuesday, August 12, 2014

Merge two kmer count hashes into one

 #!/usr/bin/perl  
 use warnings;  
 # Input parameters  
 open FASTA1, $ARGV[0] or die $!;  
 open FASTA2, $ARGV[1] or die $!;  
 my %seqs = ();  
 while($line = <FASTA1>){  
 chomp $line;  
 my @jelly=split(/\s+/,$line);  
 $seqs{$jelly[0]}=$jelly[1];  
 }  
 close FASTA1;  
 while($line = <FASTA2>){  
 chomp $line;  
 my @jelly=split(/\s+/,$line);  
 if(exists $seqs{$jelly[0]}){$seqs{$jelly[0]}=$seqs{$jelly[0]}+$jelly[1];}  
 else{$seqs{$jelly[0]}=$jelly[1];}  
 }  
 close FASTA2;  
 foreach $iso (sort keys %seqs) {  
 print "$iso\t$seqs{$iso}\n";  
 }  

Will take two lists of kmer counts and merge them into one. A kmer count list consists of two columns. The first column being the kmer itself and the second being its count.

This might be useful in merging the output of a program like jellyfish after running it on each chromosome separately. While jellyfish has a merge function, it requires the hashes to be of equal size.

May be this can be re-written as a perl one liner...

Ka ka ka ka ka ka ka ka

Previous crow stuff has been covered by Jerry Coyne himself. This in turn stimulates lot of debate on what constitutes a species. Fortunately, most people agree that understanding the genetics is more important and relevant than fighting over the definition of species. 

Like the title of this post, the call of a crow can be written as "ka ka ka ka ka" or "kaw kaw kaw kaw" or "Caw caw caw caw". They are all trying to capture the same thing. As long as the underlying genetics is well understood, it should be ok to not worry about the definition for now. Hopefully, over time our understanding of genetics will be so good that we may even come up with a single definition that most of us can agree on.

Monday, August 11, 2014

Get overlapping sequences from multifasta file

 #!/usr/bin/perl  
 #use strict;  
 use warnings;  
 # Input parameters  
 open FASTA, $ARGV[0] or die $!;  
 my $seqst_temp="";  
 my %seqs = ();  
 my $iso="";  
 my $maxlen=0;  
 my $maxval="";  
 while($line = <FASTA>){  
 if($line=~ /^>/){  
 if($header){  
 $seqs{$header}=$seqst_temp;  
 }  
 chomp $line;  
 $header="";  
 $header=$line;  
 $seqst_temp="";  
 }  
 else{  
 $line =~ s/[\n\t\f\r_0-9\s]//g;  
 $seqst_temp .= $line;  
 }  
 }#end of while loop  
 if($header){  
 $seqs{$header}=$seqst_temp;  
 }  
 close FASTA;  
 $maxlen=0;  
 foreach $iso (sort keys %seqs) {  
 my $line1=$iso;  
 my $line2=$seqs{$iso};  
 my $flag=0,$overlap=500,$length=1000;  
 $seqlen=length $line2;  
 while(($seqlen-$flag)>$length){  
 if(($seqlen-($flag+$overlap))<$length){  
 $length=$seqlen-$flag;  
 }  
 $nextseq=substr $line2,$flag,$length;  
 print $line1.":".$flag."-".($flag+$length)."\n";  
 print $nextseq."\n";  
 $flag=$flag+$overlap;  
 }#end of seqlen while loop  
 }  

Thursday, July 17, 2014

As the crow forks

We had our work on crows (The genomic landscape underlying phenotypic integrity in the face of gene flow in crows) published in the journal Science. Very interesting interpretations of the work ranging from it being proof for evolution to reasoning for human assortative mating in a political context have been presented. It has also been covered by the Swedish Radio, Der Spiegel (a popular German weekly) and few other offline sources.

A well written description of the science that puts the work in a broader context is also available.[It should also be noted that a description of another paper about the human polymorphic inversion 17q21 from the same author was a useful resource while looking at the ancestral state of our fixed differences.]

The whole genome was scanned for differences in DNA sequence content between carrion and hooded crows using 60 crows. While most of the genome is the same, small regions of the genome do show differences in DNA sequence and gene expression. These differences in DNA sequence are localized to specific regions of the genome. Infact all 81 of 82 fixed differences that we find are within a 2 megabase region. 

Snapshots of a region of the genome with fixed differences seen between hooded and carrion crow sequencing reads provides a very visual idea of how these fixed differences "look". Each of the boxes in the figure is a sequencing read (from the bam file) mapped to the reference genome. Positions which differ from the reference genome have the actual base that differs from the reference in each read.

Below figure shows the sequencing reads from one crow from Poland. Note that all the positions are similar to the reference genome. All 30 hooded crow individuals (from Sweden and Poland) look exactly like this at this base.


The next figure shows the sequencing reads from one crow from Germany at the same position as the hooded crow above. However, the blue box has "C" written in all its reads. At this position the Carrion crow has a base that is different from the Hooded crow reference genome. All the 30 carrion crows (from Spain and Germany) have this "C" base at this position.


Similar to the above position, we identify 81 other sites that show such a "fixed difference". The rest of the genome seems to be extremely similar between the carrion and hooded crows.

Friday, June 27, 2014

The Elephant Catchers

It has been 6 years since i read and blogged about Subroto Bagchi's book Go kiss the world. As with the previous book, finished reading the book "The Elephant Catchers" in one sitting. The writing style is very captivating and keeps you reading. 

The Elephant Catchers is all about growing a company that is hunting rabbits (small game) into one that now catches elephants. While many people start a startup, very few can make it into a self-sustaining and growing company. The book deals with the mistakes that happen and how to go about "fixing" those mistakes. 

Many anecdotes from different points along the way makes for an interesting read. The use of personification at different points to explain very different stories is very appealing. For example, at one point the company wins a big client who could be persuaded to hire a dog that is loyal instead of cat that is pleasing. 

Dividing the book into 6 parts with sub-chapters keeps it well organized. All of them have one thing in common, it is about scaling things. Be it scaling ideas or infrastructure the wisdom of having been there and having done that shines through brilliantly.

Monday, June 16, 2014

Largest known protein - Titin

With a length of more than 30Kb Titin is the largest known protein in the Human genome. Due to its repeated use of the same domains, it is thought have undergone very unpredictable exon losses. 

Apart from the biological reality of exon loss, the incredible length of the gene makes it prone to annotation errors. Prevalence of such large scale annotation errors makes it impossible to study the intricacies of the biology of such a gene. This is an attempt to identify such potential errors in annotation. The hope is that it will contribute to improving the annotation. 

Mutations in the Titin gene have been implicated in many diseases. Being the longest gene also makes it interesting from an evolutionary point of view. 

Chicken:

The human version of the gene (located on chr-2) has 363 annotated exons as per Human release 75 of Ensemble. The chicken version of the gene (located on chr-7) has only 47 annotated exons as per Chicken release 75 of Ensemble. Flanking genes are PLEKHA3 and CCDC141. However, a new gene, "ENSGALG00000026366" has been annotated in Chicken between PLEKHA3 and TITIN. While it has a name like "gga-mir-7474" and a link to the mirbase, it has gene type as protein coding. If that was not confusing enough, this gene has an aminoacid length of ~30Kb (has 269 exons). Given its location and length, it appears that the Titin gene has been incorrectly split into two genes (Titin itself and gga-mir-7474). As expected, the two genes are connected by a chicken cDNA EST (see figure below).


This "gga-mir-7474" gene gets top blast hit from Titin. 

So based on EST data and blast data these two genes can be merged as part of the Titin gene. We are still short by 47 more exons.

Flycatcher:

The release 75 of Ensemble has a ~61Kb long TTN gene with 106 exons annotated in Flycatcher. Two very short genes (with 1 and 2 exons) downstream from this TTN gene, ENSFALT00000015943 and ENSFALT00000003626 also give top blast hit to the TTN gene.

Even with availability of EST evidence, some very good objective predictions, the annotation seems rather sketchy.  


Wednesday, June 11, 2014

European crow hybrid zone poem

A poem by Jochen Wolf, that describes the European crow hybrid zone.

Crows are generally believed to be black,
but some think that they are grey.

fact is, both parties are right,
and anyway all crows are black at night.

but during day they meet along a narrow hybrid zone
where they eat and play.
and sometimes mate, and assortatively clone.
black with black and grey with grey.
so the question is: why do black and grey stay away.

to answer this riddle we climbed many pines,
and raised a good deal of young, for food that they shout.
we sequenced genomes and programmed
until the keyboard shines

and kind of
figured it out.


Young crows eat a lot

Young crow chicks need to be fed a lot of food. Since, they are not able to feed themselves, food has to be almost pushed down their throats. They eat meat (ox heart is supposed to be their favorite), eggs, corn etc. Some crows prefer not eating anything other than meat and can spit out the egg and corn. As they grow older, they learn to eat meat and leave the corn in the bowls. Moving worms are a big hit with crows. Although keratin rich worms are not their primary diet, they do like eating a few worms.

So a lot of protein rich food laced with vitamins, calcium (chalk) and water. Its really amazing that such small birds can eat so much food within a day. The very young crows with very tiny throats can find it hard to swallow food. Meat can also be blended into a viscous paste and fed to the crows either with a spoon or a syringe of some sort. However, as the crows get older, this should be discontinued gradually to make sure that the crows learn to use their tongue and beak.

Apart from food, captive crows need medication. The stress of being kept captive seems to make them more prone to diseases. Veterinarians working with farm birds should be able to help. However, wild birds like the crows are definitely harder to breed in captivity. Given such hardship in breeding crows in captivity, the recovery in the population of the Hawaiian crow [Alalā (Corvus hawaiiensis)] is worthy of praise.


Pictures of crow claw (obtained from dead crows with appropriate permission for research)

Friday, March 21, 2014

Perl script to get fasta sequences longer than a certain length

 #!/usr/bin/perl  
 use strict;  
 use warnings;  
 # Input parameters  
 open FASTA, $ARGV[0] or die $!;  
 my $seqst_temp="";  
 my $seqs = {GENENAME =>my $genename,LEN =>my $qcom};  
 my $iso="";  
 my $minval=$ARGV[1];  
 while($line = <FASTA>){  
 if($line=~ /^>/){  
 if($header){  
 $seqs{$seqst_temp}{GENENAME}=$header;  
 $seqs{$seqst_temp}{LEN}=length $seqst_temp;  
 }  
 chomp $line;  
 $header="";  
 $header=$line;  
 $seqst_temp="";  
 }  
 else{  
 $line =~ s/[\n\t\f\r_0-9\s]//g;  
 $seqst_temp .= $line;  
 }  
 }#end of while loop  
 if($header){  
 $seqs{$seqst_temp}{GENENAME}=$header;  
 $seqs{$seqst_temp}{LEN}=length $seqst_temp;  
 }  
 close FASTA;  
 foreach $iso (sort keys %seqs) {  
      if($seqs{$iso}{LEN} > $minval){  
      print "$seqs{$iso}{GENENAME}\n";  
      print "$iso\n";  
      }  
 }  

Example: perl getlongerthan.pl genome.fasta 100 > longerthan.100.fasta

Wednesday, January 22, 2014

Nth order Markov chain in perl given stationary distribution and transition probability matrix

A Markhov chain can be simulated given a transition probability matrix.

 #!/usr/bin/perl  
 use warnings;  
 use strict;  
 open MODELS, $ARGV[0] or die $!;  
 my $cyclestorun=20;  
 my %model=();  
 my $line = <MODELS>;chomp $line;  
 my @headers=split(/\t/,$line);  
 my @values="";  
 my @stationVals;  
 my @stationDist;  
 my $check=0;  
 my $rnd=0;  
 my $test=0;  
 my $index=0;  
 my $startval="";  
 my $preval="";  
 my $nextval="";  
 my $i=0;  
 my $j=0;  
 my $stat=0;  
 my $presub="";  
 while($line = <MODELS>){  
      chomp $line;@values=split(/\t/,$line);$check=0;  
      push(@stationVals,$values[0]);  
      push(@stationDist,$values[1]);  
      for($i=2;$i<scalar @headers;$i++){  
      $check+=$values[$i];  
      if($check>1){print "Error in Transition probability matrix in line: $line\n";exit;}  
      $model{$values[0]}{$headers[$i]}=$values[$i];  
 #     print "$values[0]\t$headers[$i]\t$model{$values[0]}{$headers[$i]}\n";  
      }  
 }#end of while loop  
 close MODELS;  
      print "\t\t\tInitialising stationary distribution\n\n\n";  
 $check=0;  
 foreach $stat(@stationDist){  
      $check+=$stat;  
      if($check>1){print "Error in Stationary distribution.Probability greater than 1!\n";exit;}  
 }  
 $rnd=rand(1);  
 $test=0;  
 foreach $stat(@stationDist){  
      $test+=$stat;  
      if($rnd<$test){  
      $startval=$stationVals[$index];  
      #exit the foreach loop  
      $test=-100;  
      }  
 $index++;  
 }  
      print "\t\tInitial step\t$rnd\t$startval\n\n";  
 $preval=$startval; $test=0;  
 for($j=1;$j<=$cyclestorun;$j++){  
      $test=0;$rnd=rand(1);  
      for($i=2;$i<scalar @headers;$i++){  
      $test+=$model{$preval}{$headers[$i]};  
           if($rnd<$test){  
           $nextval=$headers[$i];  
           #exit the foreach loop  
           $test=-100;  
           }  
      }  
      if((length $preval)>1){$presub=substr $preval,1,1;}  
      $preval=$presub . $nextval;  
      print "\t\t$j\t$rnd\t$preval\n";  
 }#end of cyclestorun loop  

Example cases:

First order Markhov chain:
The "stat" column corresponds to the stationary matrix.

Model:
      stat     A     G     T  
 A     0.1     0.1     0.5     0.4  
 G     0.5     0.9     0.1     0  
 T     0.4     0.3     0.3     0.4  

Output:

 perl markhov.pl Markhov1.model  
                Initialising stationary distribution  
           Initial step     0.566160679402859     G  
           1     0.726538222140761     A  
           2     0.307280103481514     G  
           3     0.892182052225458     A  
           4     0.336793610721617     G  
           5     0.205083725028075     A  
           6     0.523360180106774     G  
           7     0.376126474509043     A  
           8     0.385466656638901     G  
           9     0.357110639627308     A  
           10     0.940985077542603     T  
           11     0.567528252945955     G  
           12     0.215130112396754     A  
           13     0.737550170708133     T  
           14     0.372513088005231     G  
           15     0.87686981502349     A  
           16     0.534856061888437     G  
           17     0.94194553431501     G  
           18     0.800215938891096     A  
           19     0.990931721477871     T  
           20     0.371922711443307     G  

Second order Markhov chain:

Model:
      stat     A     G     T  
 AA     0.1     0.1     0.5     0.4  
 AG     0.05     0.9     0.1     0  
 AT     0.04     0.3     0.3     0.4  
 GA     0.2     0.1     0.5     0.4  
 GG     0.1     0.9     0.1     0  
 GT     0.1     0.3     0.3     0.4  
 TA     0.1     0.1     0.5     0.4  
 TG     0.1     0.9     0.1     0  
 TT     0.2     0.3     0.3     0.4  

Output:

 perl markhov.pl Markhov2.model  
                Initialising stationary distribution  
           Initial step     0.625368699737923     TA  
           1     0.590942442973272     AG  
           2     0.0483144526753101     GA  
           3     0.0103876021193585     AA  
           4     0.367650618439331     AG  
           5     0.973362473523579     GG  
           6     0.310508404063821     GA  
           7     0.890260746277896     AT  
           8     0.4738624084188     TG  
           9     0.158245684870735     GA  
           10     0.295448727223441     AG  
           11     0.33900585792933     GA  
           12     0.988197918079994     AT  
           13     0.366480732651112     TG  
           14     0.229562890090616     GA  
           15     0.543711924314373     AG  
           16     0.114082525688733     GA  
           17     0.850092575768059     AT  
           18     0.546652122930436     TG  
           19     0.715004225102355     GA  
           20     0.20491958253287     AG  

Any number of states can be added, as well as any order can be simulated.

Zero-order:

Model:
      stat     A     G     T  
 A     0.33     0.33     0.33     0.33  
 G     0.33     0.33     0.33     0.33  
 T     0.33     0.33     0.33     0.33  

Output:
 perl markhov.pl Markhov0.model  
                Initialising stationary distribution  
           Initial step     0.804352114516409     T  
           1     0.967022104046436     T  
           2     0.146048431090218     A  
           3     0.168446080849158     A  
           4     0.806730437919288     T  
           5     0.0541887571889532     A  
           6     0.90109841189982     T  
           7     0.815255933249396     T  
           8     0.647698135106484     G  
           9     0.93008693266961     T  
           10     0.721468943653047     T  
           11     0.311067960681136     A  
           12     0.231977046730197     A  
           13     0.251340034965111     A  
           14     0.140686836632536     A  
           15     0.0760768098699529     A  
           16     0.182739903656344     A  
           17     0.496555550139448     G  
           18     0.219248000363631     A  
           19     0.163342643602853     A  
           20     0.994710285749438     A  
And now to use it in a real world application....any suggestions?