Thursday, January 29, 2015

Mapping centromeres using Optical Map data

Optical mapping has become rather common for applications ranging from genome assembly improvement and validation to structural variation discovery. Validation of the rice genome using Optical map data also helped map centromeres and even span one centromere. However, in some cases centromeres have been found to correspond to regions that have poor mapping of optical maps, presumably due to the presence of tandem repeats that lack unique restriction sites. Without the availability of genetic linkage maps or other evidence, those working with NGS based draft assemblies have speculated that large gaps in the optical map correspond to centromeres or other repeats.

The Human genome has a higher quality as well as availability of various other resources such as genetic linkage maps, BAC's, FISH etc in addition to the availability of optical mapping data. Centromeres have been mapped in the human genome with various other methods and provides an ideal case to investigate the patterns(or lack thereof) shown by optical maps near centromeres. Optical map data for the human and mouse genome from published studies have been made available as bigBed files. This provides a unique resource to understand the behavior of optical maps near centromeres.

First we download the bigBed files for the human genome Hg38 and convert it to bed12 format. This can then be converted to bed format using the convert perl script

 wget ftp://ngs.sanger.ac.uk/production/grit/track_hub/hg38/om_align_GM10860.bigBed  
 wget ftp://ngs.sanger.ac.uk/production/grit/track_hub/hg38/om_align_GM15510.bigBed  
 wget ftp://ngs.sanger.ac.uk/production/grit/track_hub/hg38/om_align_GM18994.bigBed  
 for i in om_align_GM10860 om_align_GM15510 om_align_GM18994  
 do  
 bigBedToBed "$i".bigBed "$i".bed  
 perl convertBed.pl "$i".bed > "$i"_full.bed  
 done  

Perl script called covertBed.pl to convert bed12 to bed format.

 #!/usr/bin/perl  
 my $bed12file = $ARGV[0];  
 open(FILE1, $bed12file);  
      while($header1=<FILE1>) {  
      chomp $header1;  
      my @parts=split(/\t/,$header1);  
      my @parts2=split(/\,/,$parts[10]);  
      my @parts3=split(/\,/,$parts[11]);  
      my $arrSize = @parts2;  
           for($i=0;$i<$arrSize;$i++){  
           $start=$parts[1]+$parts3[$i];  
           $end=$start+$parts2[$i];  
           print "$parts[0]\t$start\t$end\t$parts2[$i]\n";  
           }  
      }  
 close FILE1;  
We next create 50Kb windows across the human genome to analyze the distribution of cut sites in the Optical map.
 mysql --user=genome --host=genome-mysql.cse.ucsc.edu -B -A -D hg38 -e 'select chrom,size from chromInfo' > chromhg38.genome  
 bedtools makewindows -g chromhg38.genome -w 50000|sort -k1,1 -k2,2n > 50kb.wins  
All 3 Optical maps are combined and the mean of the fragment lengths as well their counts are tabulated in 50Kb windows.
 cat *_full.bed|sort -k1,1 -k2,2n > full_all.bed  
 bedtools map -a 50kb.wins -b full_all.bed -c 4 -o mean -null NA > all.mean  
 bedtools map -a 50kb.wins -b full_all.bed -c 4 -o count -null NA > all.count  
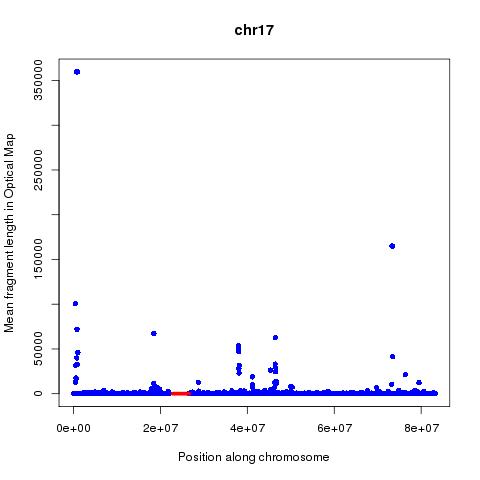
Analysis of these numbers across each chromosome suggests that mean fragment size might be a better predictor of centromeres than the count. The position of the centromeres is obtained from the UCSC tables using below command:

 mysql --user=genome --host=genome-mysql.cse.ucsc.edu -B -A -D hg38 -e 'select chrom,chromStart,chromEnd from centromeres'|grep -v "chromStart" > centromeres.hg38.genome  
Running below R code will create graphical images showing the position of the centromeres by red lines and the mean fragment size by blue dots.
 for (chr in c("chr1","chr2","chr3","chr4","chr5","chr6","chr7","chr8","chr9","chr10","chr11","chr12","chr13","chr14","chr15","chr16","chr17","chr18","chr19","chr20","chr22","chrX"))  
 {  
 read.table(file="all.mean",header=F)->M  
 read.table(file="centromeres.hg38.genome",header=F)->C  
 interleave <- function(v1,v2)  
 {  
 ord1 <- 2*(1:length(v1))-1  
 ord2 <- 2*(1:length(v2))  
 c(v1,v2)[order(c(ord1,ord2))]  
 }  
 jpeg(paste(chr,"_OM.jpeg",sep=""))  
 plot(M$V2[M$V1==chr],M$V4[M$V1==chr],xlab="Position along chromosome",ylab="Mean fragment length in Optical Map",main=chr,col="blue",pch=16)  
 lines(interleave(C$V2[C$V1==chr],C$V3[C$V1==chr]),rep(0.2,length(interleave(C$V2[C$V1==chr],C$V3[C$V1==chr]))),col="red",lwd=5)  
 dev.off()  
 }  
Based on below figures, it can be hypothesized that on chr1, chr2, chr3(to certain extent), chr7, chr9, chr11(to certain extent),chr12,chr13, chr14,chr15 and chr20 the mean optical fragment size goes up near centromeres.


Based on the above analysis can one conclude that it is possible to map Centromeres using Optical mapping data? Far from it, the many false positives and lack of signal in many cases are worrying. The following questions are of importance:
 
  1. How does the quality of the genome assembly in the regions adjoining the centromere affect the ability to map centromeres?
  2. How does the enzyme used and repeat content and base composition of the centromere affect the precision of attempts aimed at mapping the centromere?

Titin gene in Fugu - 3 copies or annotation and assembly error?

My growing obsession with the TITIN gene is hopefully not a sign of something else.

The Fugu genome was sequenced, assembled and released soon after the human genome. As was customary during the release of genomes at the beginning of the genomic era it was released with much fanfare. It was flaunted as a good model for comparing synteny with the Human genome. Analysis of the Fugu genome has also been used to find evidence for whole genome duplication in Ray-Finned fish

Titin has two copies, ENSTRUT00000001472 flanked by enox1 and AIM29 [Altered Inheritance rate of Mitochondria] (annotated as 1 of 2) and ENSTRUG00000003764 flanked by TTNB and ubiquitin-conjugating enzyme E2G 2 (TTN 2 of 2). So this suggests the Fugu genome has 3 copies of the Titin gene, if one considers the TTNB gene as the third copy. 

Existence of two adjacent copies of the Titin gene in Zebrafish has been validated by multiple methods. This can also be seen reflected in the latest release of the assembly. TTNA (ENSDARG00000028213) and TTNB (ENSDARG00000000563) are atleast 93 and 82 Kb long. 

The African clawed frog has a different view of things with the TTN gene (ENSXETG00000015021) followed by the TN (Titin Novex-3 or ENSXETG00000024421) gene. While the TTN gene is ~94 Kb long, the Tn gene is annotated as a paralog and has a length of ~15Kb. 

A rather complex history of duplication, retention and loss of this gene which also happens to be the longest known gene makes its annotation and study all the more difficult. Functional characterization of the various orthologs, paralogs and isoforms might be a way forward to understand and distinguish assembly/annotation errors from real biology. 

Wednesday, January 14, 2015

A tale of two Jared's

Both Jared Taylor and Jared Diamond, born to immigrant parents attended Ivy league colleges, wrote many books about humans. Specifically about the explanations for the differences between Eurasian people and other populations they conquered or displaced. These differences have shaped human history almost as much as the atom bomb or the motor car. Even today, study and discussion of such differences are very emotional issues.

While Taylor "eloquently" argues for a biological and genetic basis for these differences, Diamond has written books that provide an elaborate non-genetic explanation that invokes ecology to explain these differences. Diamond, argues that differences in the success of different populations could be attributed to prevalence of very different species of plants and animals in the continents inhabited by these populations. 

Although they share their first names, they are atleast as different as Paris and London. The demoralizing situation of the French peasantry is similar to situation faced by members of certain ethnic groups who happen to listen to Taylor speak. Availability of these videos on youtube makes it rather easy for any casual internet user to stumble upon it. 

The question is can one draw unflattering parallels to the explanation provided by Diamond? For instance it might not be possible to accept the explanation provided by Jared Diamond while still believing in some sort of concept of a benevolent god. Diamond provides arguably the best non-genetic explanation for the differences between human populations. Unfortunately, it fails to explain numerous inconsistencies. Lack of numerous more convincing explanations definitely needs to be remedied.

Wednesday, January 7, 2015

Basket with a child inside and a river

As far as similarities go, this is definitely something worth noting. Two great epics, one being the Bible and the other the Mahabharata have very similar situations.


But when she could hide him no longer, she got a papyrus basket for him and coated it with tar and pitch. Then she placed the child in it and put it among the reeds along the bank of the Nile. Exodus 2:3

The above verse from the Exodus talks about how Moses (one of the great heroes from the bible) was put in a basket and left in the river Nile. The below sentence taken from the Mahabharata refers to Kunti leaving her son Karna (also a central character) in the river Ganga.

Having placed him in a basket made of light materials, Kunti committed him to the current of Ganga. THE MAHABHARATA, SANTI PARVA, SECTION I

Could it just be a coincidence that in both epics, a baby in a basket is committed to a river? Other possibilities include (a) It was common practice to throw unwanted children into a nearby river (b) Stories might have had some gene flow between them over time. Do you have a different explanation?